An AI-answer citation earns a click 5.78% of the time. This study measures AI citation click-through rate, the share of displayed AI-answer citations that produce a click to the source, across three dimensions:
- Six LLMs: Perplexity, Microsoft Copilot, ChatGPT, Claude, Gemini, and Google AI Overviews.
- Fourteen industries: financial services, insurance, legal, healthcare, education, B2B technology, real estate, travel and hospitality, automotive, manufacturing and industrial, ecommerce and retail, home services, local services, and media and publishing.
- Four query types: navigational, transactional, commercial, and informational.
That is 336 LLM-industry-query combinations. The gap between the best and worst is 52.5x: a Perplexity citation on a navigational financial services query is clicked 35.18% of the time, while a Google AI Overviews citation on an informational media query is clicked 0.67% of the time. All three dimensions matter, but not equally: the LLM swings CTR 9.1x, query type 2.8x, and industry 2.1x. The definitions, the method, and every breakdown follow.
Definitions
- AI citation CTR: of the AI answers that display a citation, the share that produce a click to that source.
- Citation frequency: the share of an LLM’s answers that display any source citation at all.
- Referral share: an LLM’s slice of all AI-answer referral traffic to publishers.
- Clicks per 1,000 answers: the absolute click yield of being cited, combining citation frequency with CTR.
- Query types: navigational (reach a specific site), transactional (ready to buy or act), commercial (comparing options before buying), informational (a quick fact or explanation).
- Index: a segment’s CTR against the 5.78% study average, where 100 equals average. An index of 132 means that segment earns 32% more clicks per citation than the average.
- Combination: one engine paired with one industry and one query type, for example a Perplexity citation on a transactional legal query.
Key findings
- Study average: 5.78%, weighted for the real mix of AI queries. The unweighted mean across all 336 combinations is 7.39%.
- The LLM matters most, query type second, industry third. Moving from the worst LLM to the best multiplies CTR 9.1x; from informational to navigational intent, 2.8x; from the worst vertical to the best, 2.1x.
- Intent separates sharply. Transactional citations are clicked 8.64% of the time against 3.63% for informational, a 2.4x difference, yet informational queries are 52% of all AI questions. The largest slice of AI volume is the hardest to convert.
- Reach and efficiency are inverted. ChatGPT holds 78.4% of AI referral traffic but returns 14.5 clicks per 1,000 answers; Perplexity holds 7.2% and returns 136.3.
- Higher-stakes verticals earn the most verification clicks: financial services (7.63%, index 132), insurance (7.46%), legal (7.24%), healthcare (6.97%). Media and publishing sits lowest at 3.70% (index 64).
How we ran this study
We compiled reported AI-referral and citation data from the sources listed at the end, restated every figure against one common definition (a click on a displayed citation), and applied Focus Digital’s benchmarking methodology to build one consistent set of comparisons. Four calculations define the dataset.
- AI citation CTR = citation clicks divided by answers that display the citation, times 100.
- Each combination = the engine’s base rate adjusted for the industry and the query type.
- Clicks per 1,000 answers = citation frequency multiplied by CTR, divided by 10.
- The study average is weighted by query mix (informational 52%, commercial 24%, transactional 16%, navigational 8%), so it reflects the questions people actually ask rather than treating all four intents as equally common.
Why this study reads differently than others
Three choices set it apart. First, it measures the click on a displayed citation, not how often an LLM cites (citation frequency) and not an LLM’s share of referral traffic. Those three get conflated constantly and answer different questions, so we report all three side by side. Second, it compares all three dimensions against each other rather than reporting each in isolation, because the interaction is where the usable number lives: a law firm optimizing for Perplexity on transactional queries and the same firm cited in AI Overviews on informational ones face a 10x difference in click yield from identical content. Third, it pairs CTR with citation frequency to produce clicks per 1,000 answers, the figure that actually predicts traffic, because a high CTR is worthless if the LLM rarely cites at all.
By query type: intent decides the click
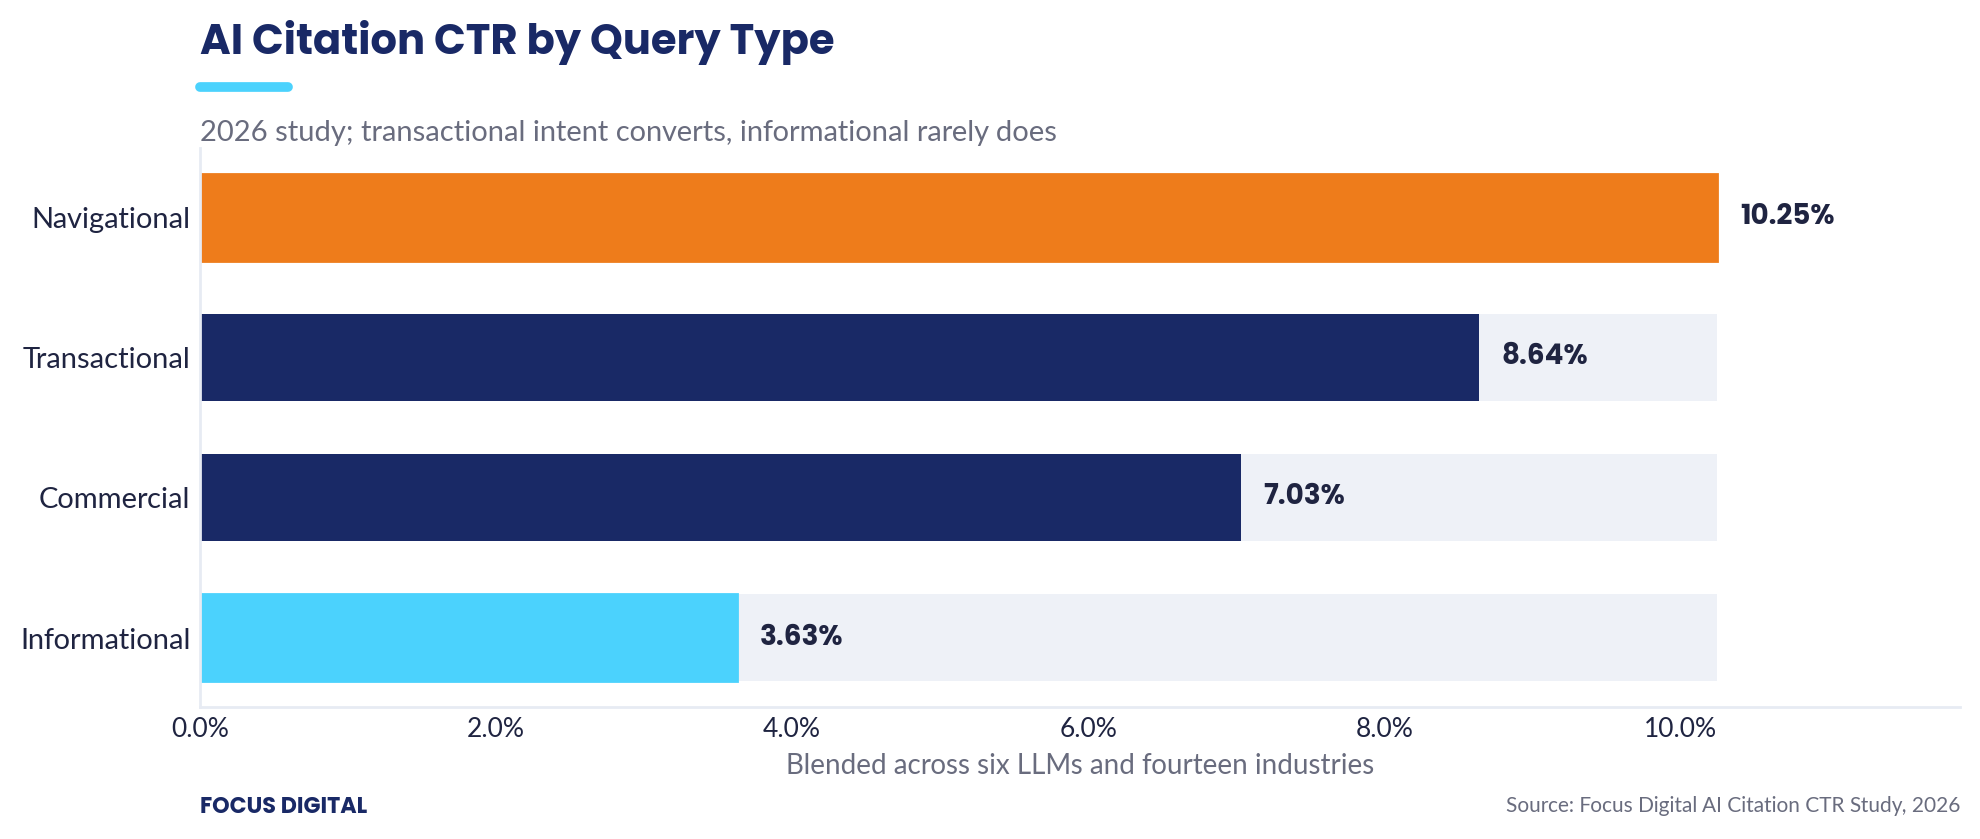
A navigational searcher wants a destination, so the citation is the point. A transactional searcher is ready to act and needs to reach a provider. An informational searcher usually gets the whole answer in the response and never clicks. The mix column matters as much as the rate.
| Query type | AI citation CTR | Index | Share of AI queries | What the searcher wants |
|---|---|---|---|---|
| Navigational | 10.25% | 177 | 8% | To reach a specific site |
| Transactional | 8.64% | 149 | 16% | To buy or act now |
| Commercial | 7.03% | 122 | 24% | To compare options first |
| Informational | 3.63% | 63 | 52% | A quick fact or explanation |
Weighted by that mix, the blended rate lands at 5.78%. An unweighted average across the four intents would read 7.39% and overstate the traffic a citation actually produces.
By LLM: CTR is not the whole story
Where an LLM places its citations predicts the click rate. Perplexity puts sources inline and in a sidebar beside the answer; Google AI Overviews places links below a full answer that already satisfies most readers.
| LLM | AI citation CTR | Citation frequency | Referral share | Clicks per 1,000 answers | Citation placement |
|---|---|---|---|---|---|
| Perplexity | 14.82% | 92% | 7.2% | 136.3 | Inline + sidebar |
| Microsoft Copilot | 6.14% | 74% | 3.4% | 45.4 | Inline footnotes |
| ChatGPT | 4.27% | 34% | 78.4% | 14.5 | Inline footnotes |
| Claude | 3.96% | 38% | 1.1% | 15.0 | Inline links |
| Gemini | 3.38% | 41% | 2.1% | 13.9 | Below the answer |
| Google AI Overviews | 1.63% | 61% | 7.8% | 9.9 | Below the answer |
Claude returns slightly more clicks per 1,000 answers than ChatGPT (15.0 against 14.5) despite a lower CTR, because it cites more often. ChatGPT’s dominance comes from query volume, not from generous citation behavior.
Every LLM by query type
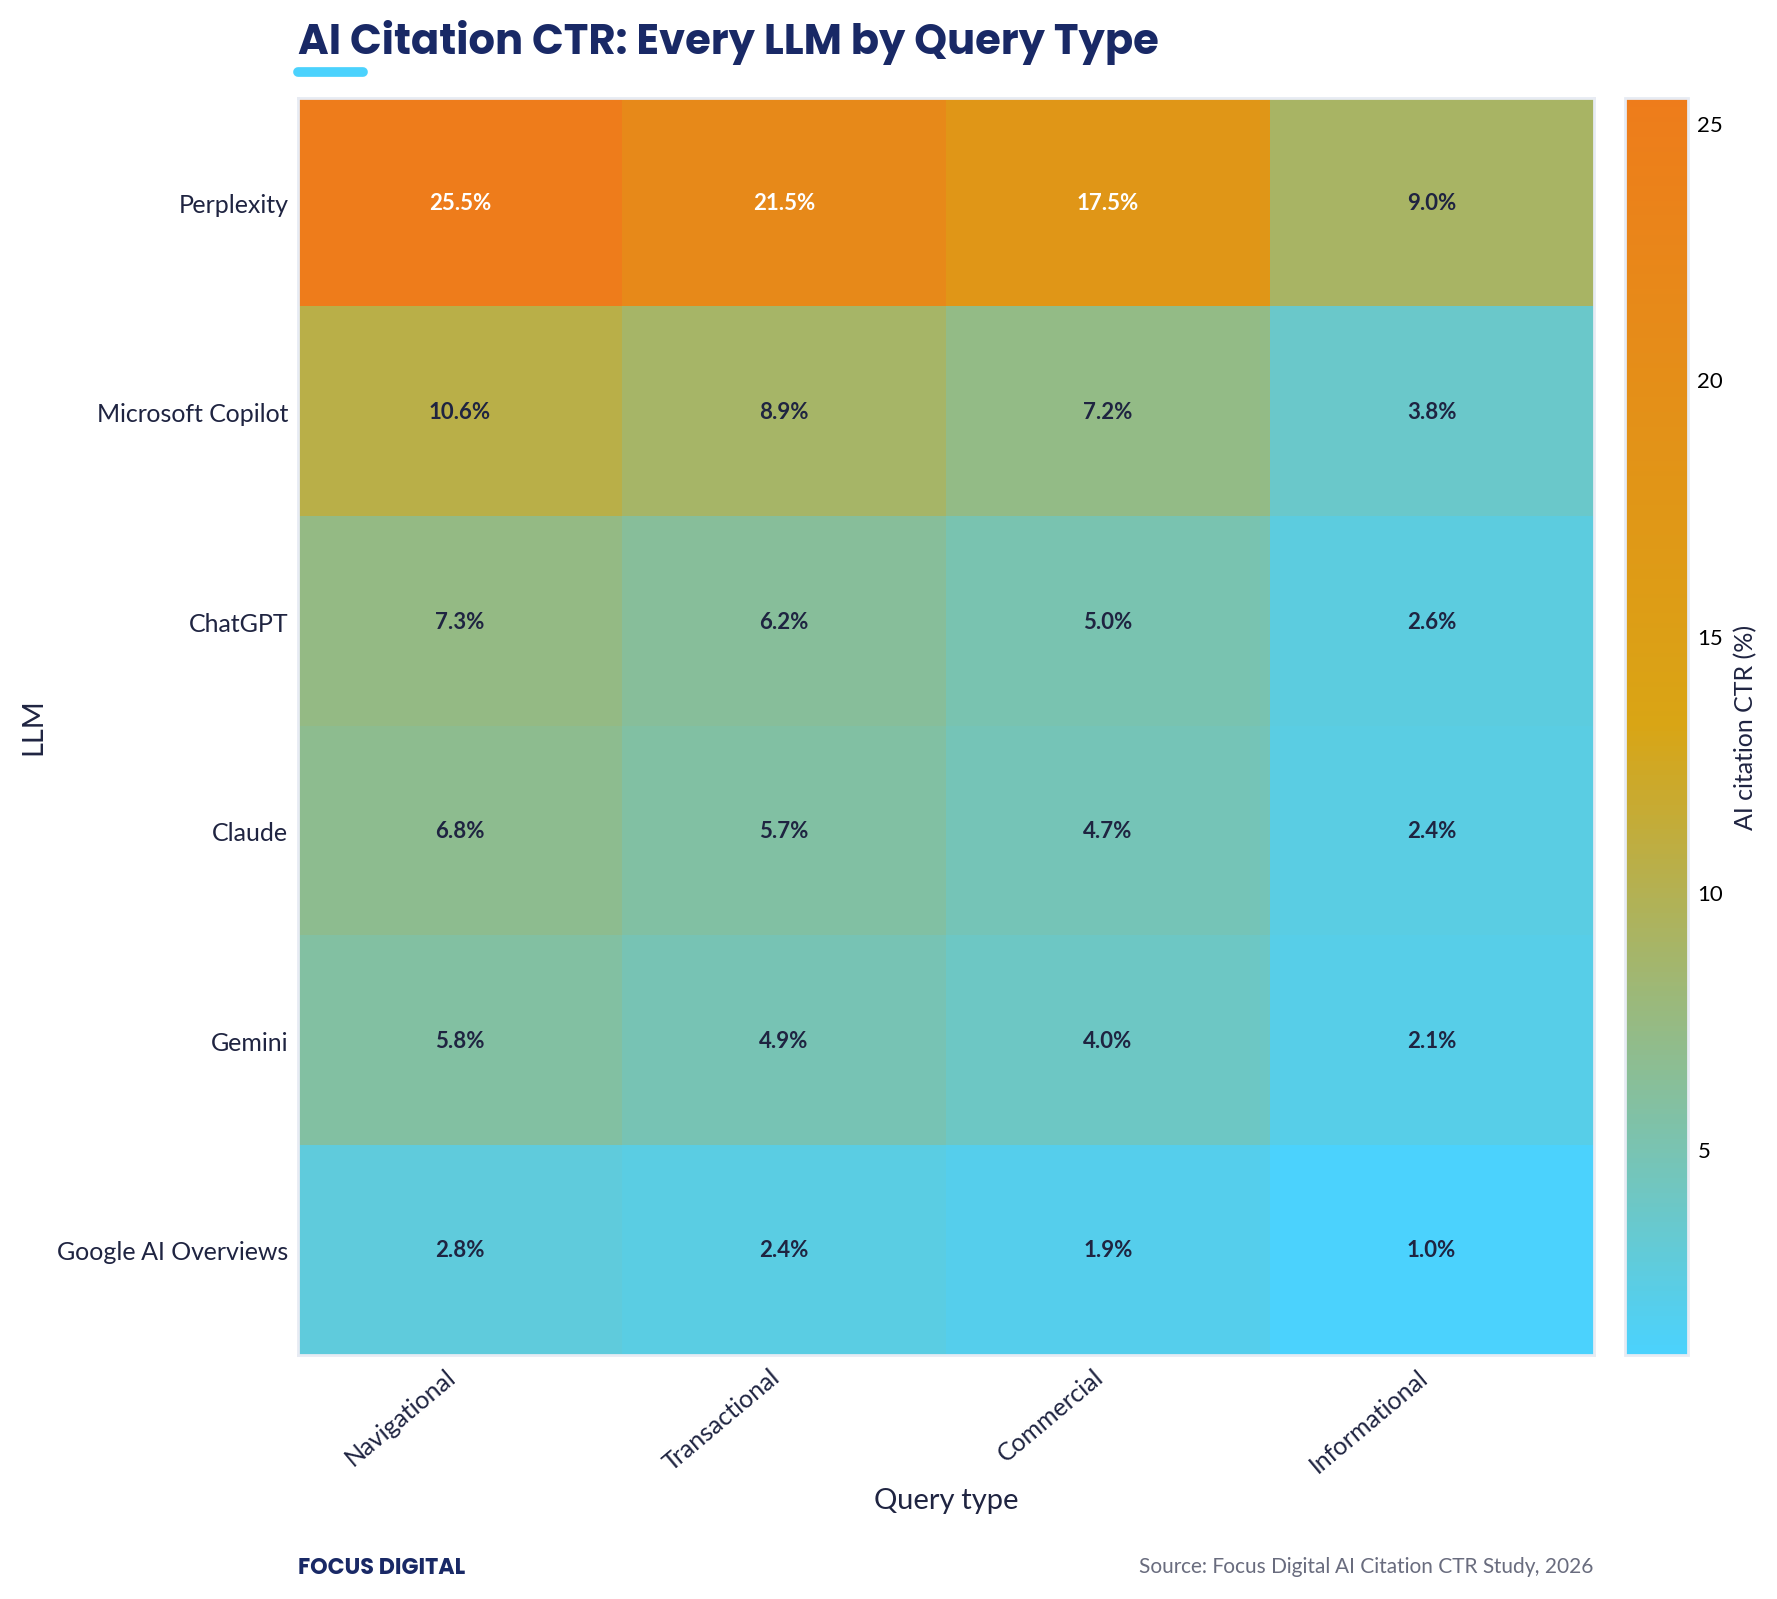
| LLM | Navigational | Transactional | Commercial | Informational |
|---|---|---|---|---|
| Perplexity | 25.49% | 21.49% | 17.49% | 9.04% |
| Microsoft Copilot | 10.56% | 8.90% | 7.25% | 3.75% |
| ChatGPT | 7.34% | 6.19% | 5.04% | 2.60% |
| Claude | 6.81% | 5.74% | 4.67% | 2.42% |
| Gemini | 5.81% | 4.90% | 3.99% | 2.06% |
| Google AI Overviews | 2.80% | 2.36% | 1.92% | 0.99% |
Even Perplexity, the strongest performer, loses nearly two-thirds of its click-through moving from navigational (25.49%) to informational (9.04%) intent. On informational queries, Google AI Overviews falls below 1%.
By industry: fourteen verticals
Readers verify claims about their health, their case, or their money before acting, so those verticals convert citations into clicks at the highest rate. Low-stakes content earns the mention but rarely the visit.
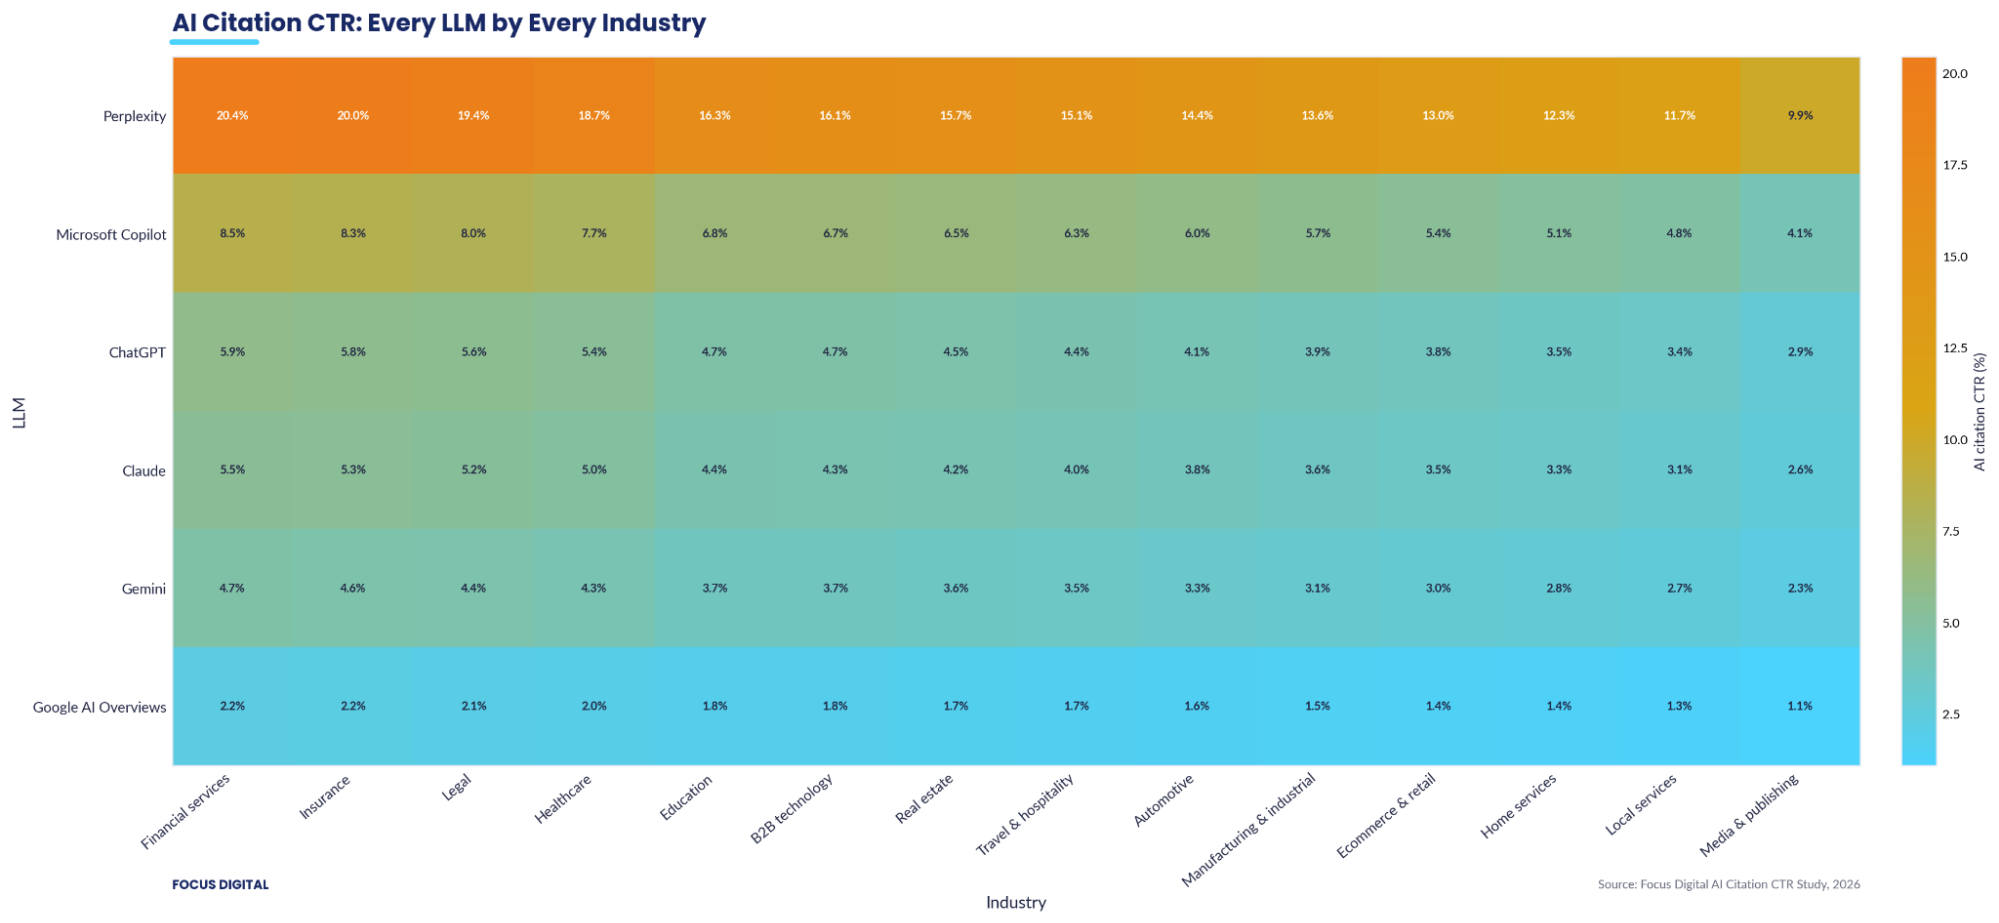
The third column is each industry’s ceiling: what a citation earns in the best case, which is a Perplexity citation on a navigational query. Compare it to the blended rate to see how much the engine and the intent change the outcome for the same industry.
| Industry | Typical AI citation CTR | Index | Best case: Perplexity, navigational query |
|---|---|---|---|
| Financial services | 7.63% | 132 | 35.18% |
| Insurance | 7.46% | 129 | 34.41% |
| Legal | 7.24% | 125 | 33.39% |
| Healthcare | 6.97% | 121 | 32.12% |
| Education | 6.08% | 105 | 28.04% |
| B2B technology | 6.03% | 104 | 27.78% |
| Real estate | 5.86% | 101 | 27.02% |
| Travel & hospitality | 5.64% | 98 | 26.00% |
| Automotive | 5.36% | 93 | 24.73% |
| Manufacturing & industrial | 5.09% | 88 | 23.45% |
| Ecommerce & retail | 4.87% | 84 | 22.43% |
| Home services | 4.59% | 79 | 21.16% |
| Local services | 4.37% | 76 | 20.14% |
| Media & publishing | 3.70% | 64 | 17.08% |
Every industry by query type
Blended across all six LLMs, this view shows what a vertical can expect from each intent. Financial services on a navigational query reaches 13.5%; media and publishing on an informational one falls to 2.3%.
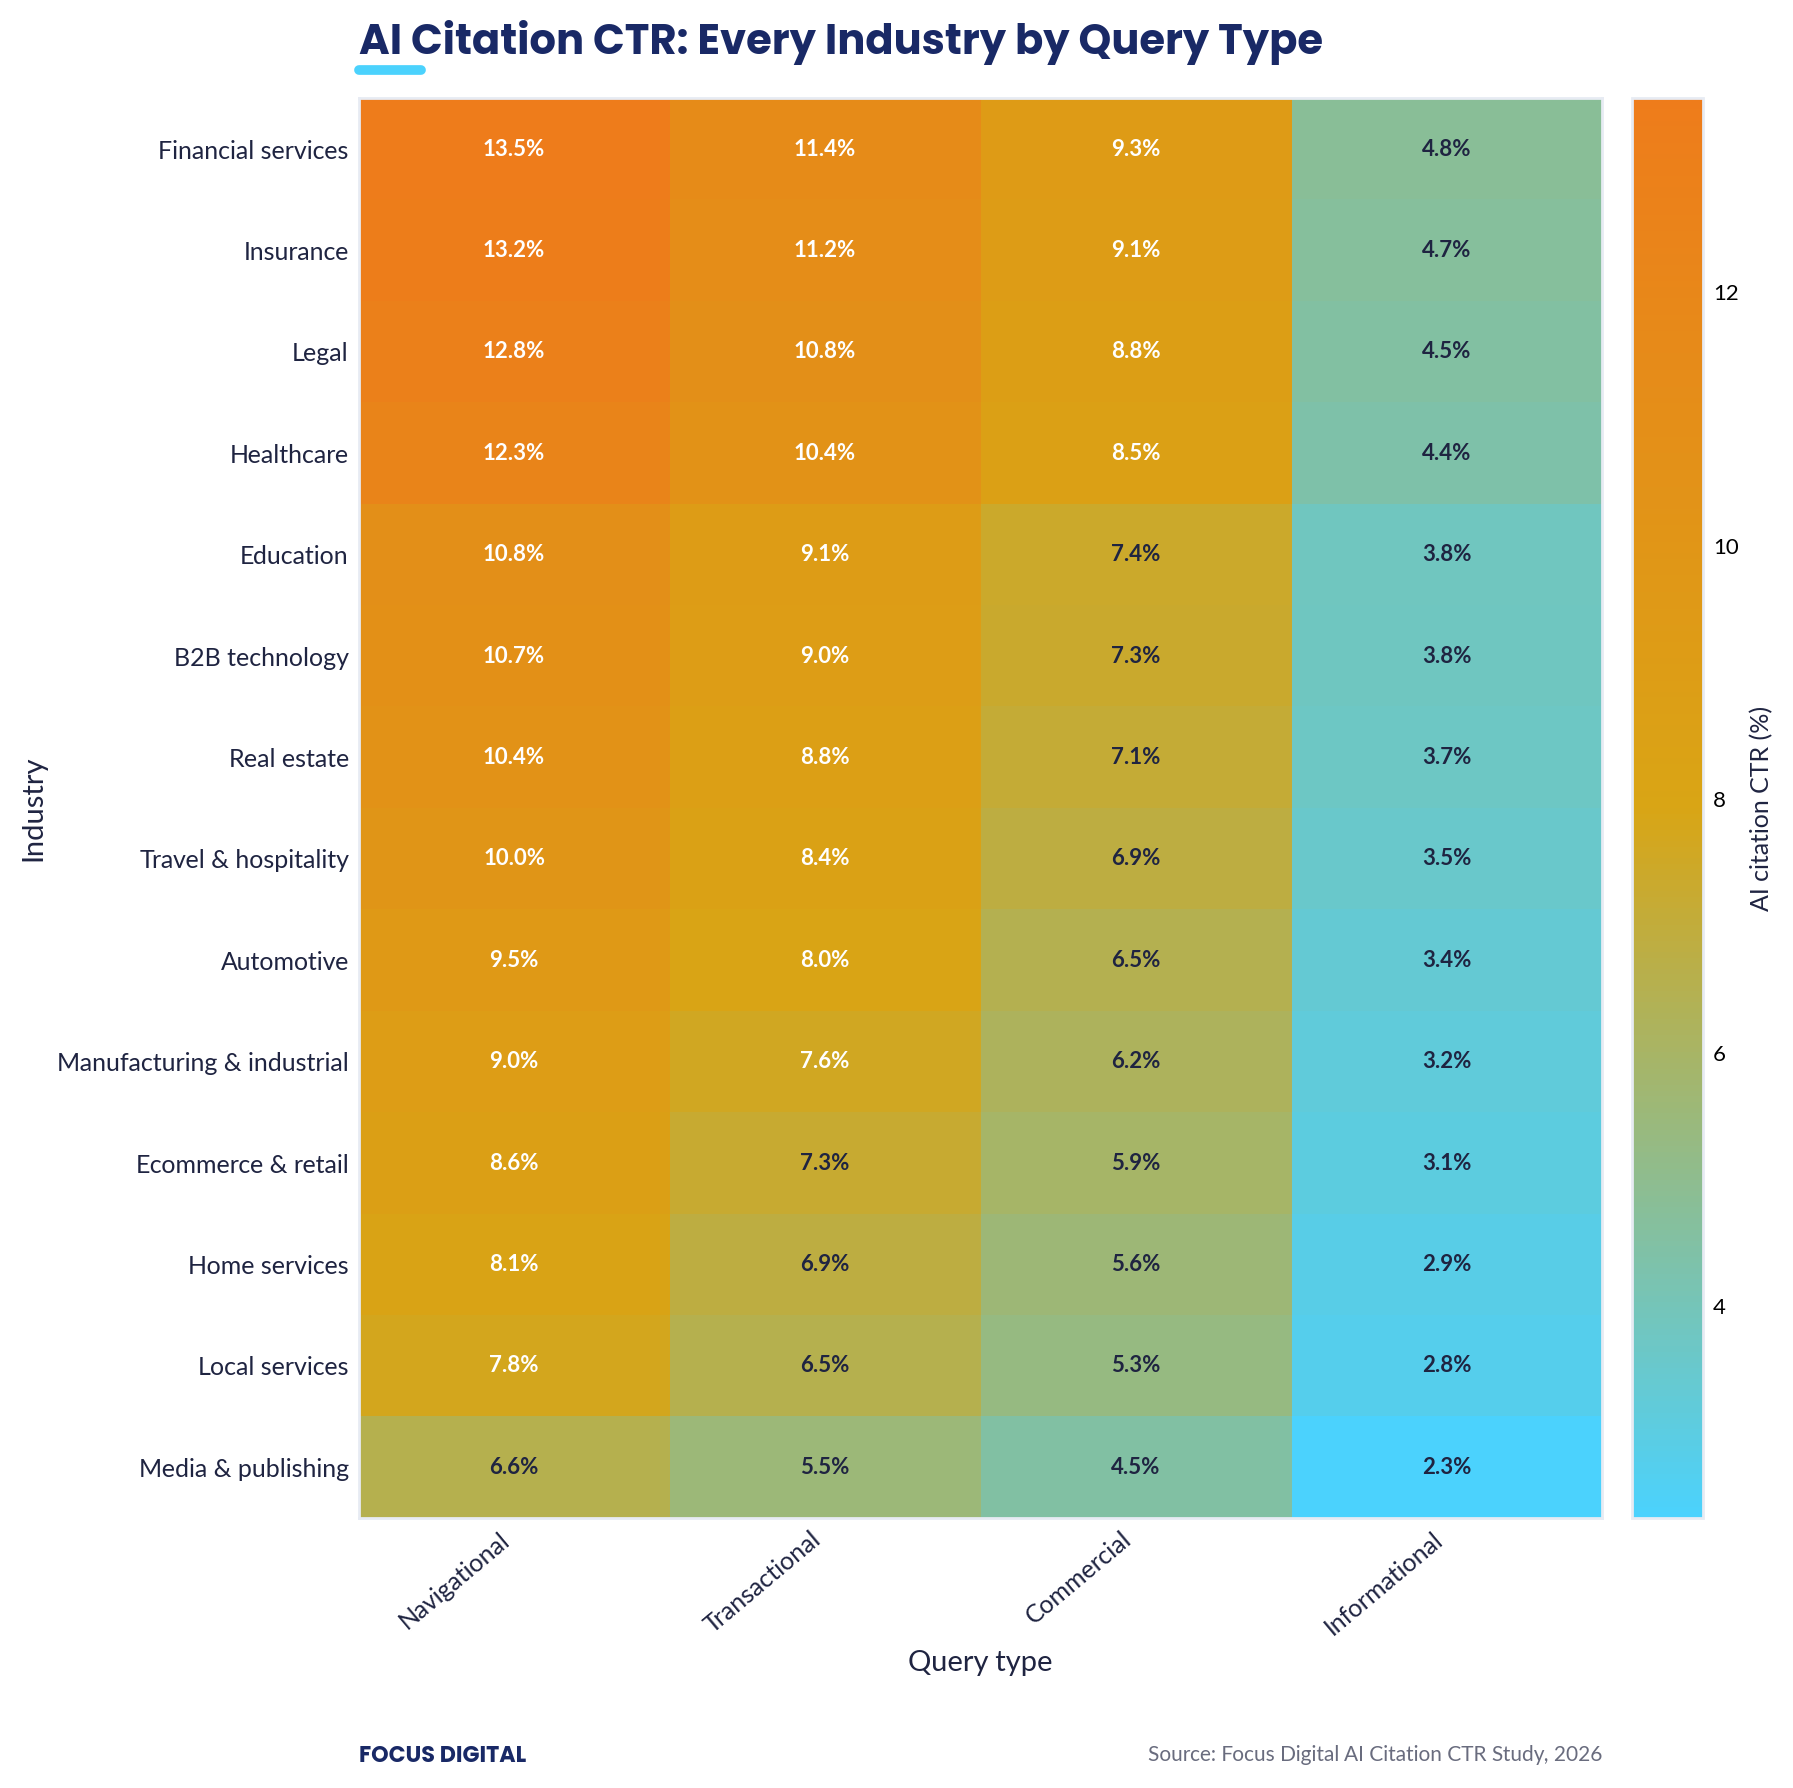
How much industry changes CTR within each LLM
Industry moves the number, but how much depends on the LLM. The more prominently an LLM displays citations, the more room industry has to matter.
| LLM | Best industry | Worst industry | Swing |
|---|---|---|---|
| Perplexity | 20.45% | 9.93% | 10.52 pts |
| Microsoft Copilot | 8.47% | 4.11% | 4.36 pts |
| ChatGPT | 5.89% | 2.86% | 3.03 pts |
| Claude | 5.46% | 2.65% | 2.81 pts |
| Gemini | 4.66% | 2.26% | 2.40 pts |
| Google AI Overviews | 2.25% | 1.09% | 1.16 pts |
Notable statistics
- The best combination (a Perplexity citation on a navigational financial services query, 35.18%) outperforms the worst (a Google AI Overviews citation on an informational media query, 0.67%) by 52.5x.
- Of the three dimensions, the LLM moves CTR most at 9.1x, followed by query type at 2.8x and industry at 2.1x.
- Transactional citations convert 2.4x better than informational ones, yet informational queries are 52% of all AI questions.
- Perplexity returns 136.3 clicks per 1,000 answers against ChatGPT’s 14.5, despite ChatGPT holding 78.4% of AI referral traffic to Perplexity’s 7.2%.
- At the 5.78% study average, roughly 1 in 17 citation impressions produces a click, so 16 of every 17 mentions generate no visit.
What a good AI citation CTR looks like
Benchmark against your own combination of engine and intent, not the study average. A law firm cited in AI Overviews on informational queries should expect about 1.5%, while the same firm cited in Perplexity on transactional queries should expect about 26%; judging both against 5.78% would mislead in opposite directions. Track citation CTR by engine and by intent, then prioritize where clicks exist: earn citations in Perplexity and Copilot, and target transactional and navigational queries. For informational topics, assume the answer is the destination and write the citation itself to earn the click.
Further reading and next steps
- See how we earn and measure AI citations on our Agentic GEO agency page.
- Compare this with our other benchmarks in the research and data library.
- Request the full dataset, all 336 combinations, on our contact page.
Sources
- Focus Digital AI Citation CTR Study, 2026 (primary dataset).
- SparkToro, AI referral and Perplexity citation click-through research, January 2026.
- Seer Interactive, “AIO Impact on Google CTR”, 2025 and 2026 updates.
- DigitalApplied, “AI Search Engine Statistics 2026”, for LLM referral and citation-rate ranges.