
Median speed to lead runs from 13 minutes in legal services to 8 hours and 17 minutes in real estate, while the largest audit of American businesses clocks the cross-industry average first response at 42 hours. Waiting a full day past the inquiry cuts the odds of qualifying that lead by more than 60 times.
Our research team collected every response-time audit published between 2007 and 2026 that names its sample and method, then traced each figure back to the study that produced it and discarded the uncited tables circulating online. What follows covers more than 18,000 audited companies across six verticals and prices the delay in dollars.
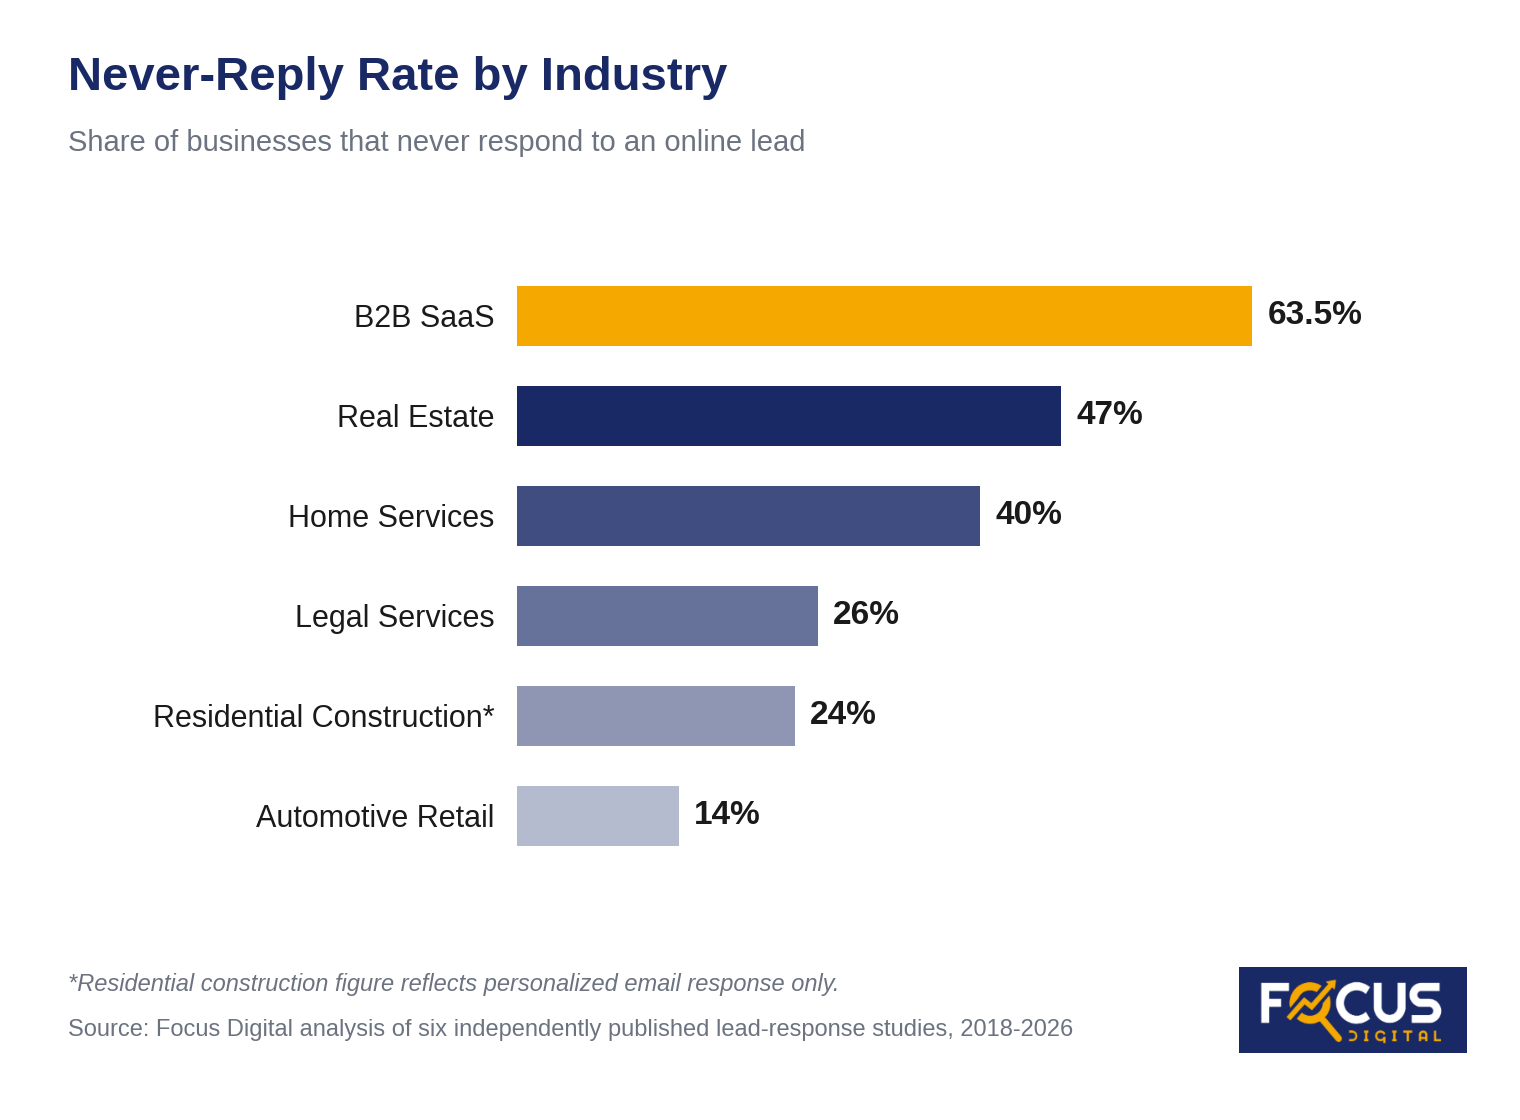 Our data indicates the gap between the fastest and slowest verticals stretches from minutes into days.
KEY INSIGHTS:
 KEY INSIGHTS:
KEY INSIGHTS:
KEY INSIGHTS:
Key Takeaways
- Legal services answers fastest of any measured industry at a 13-minute median, though 26% of law firms never reply.
- Non-response climbed from 23% of audited companies in 2011 to 63.5% of business software vendors in 2024.
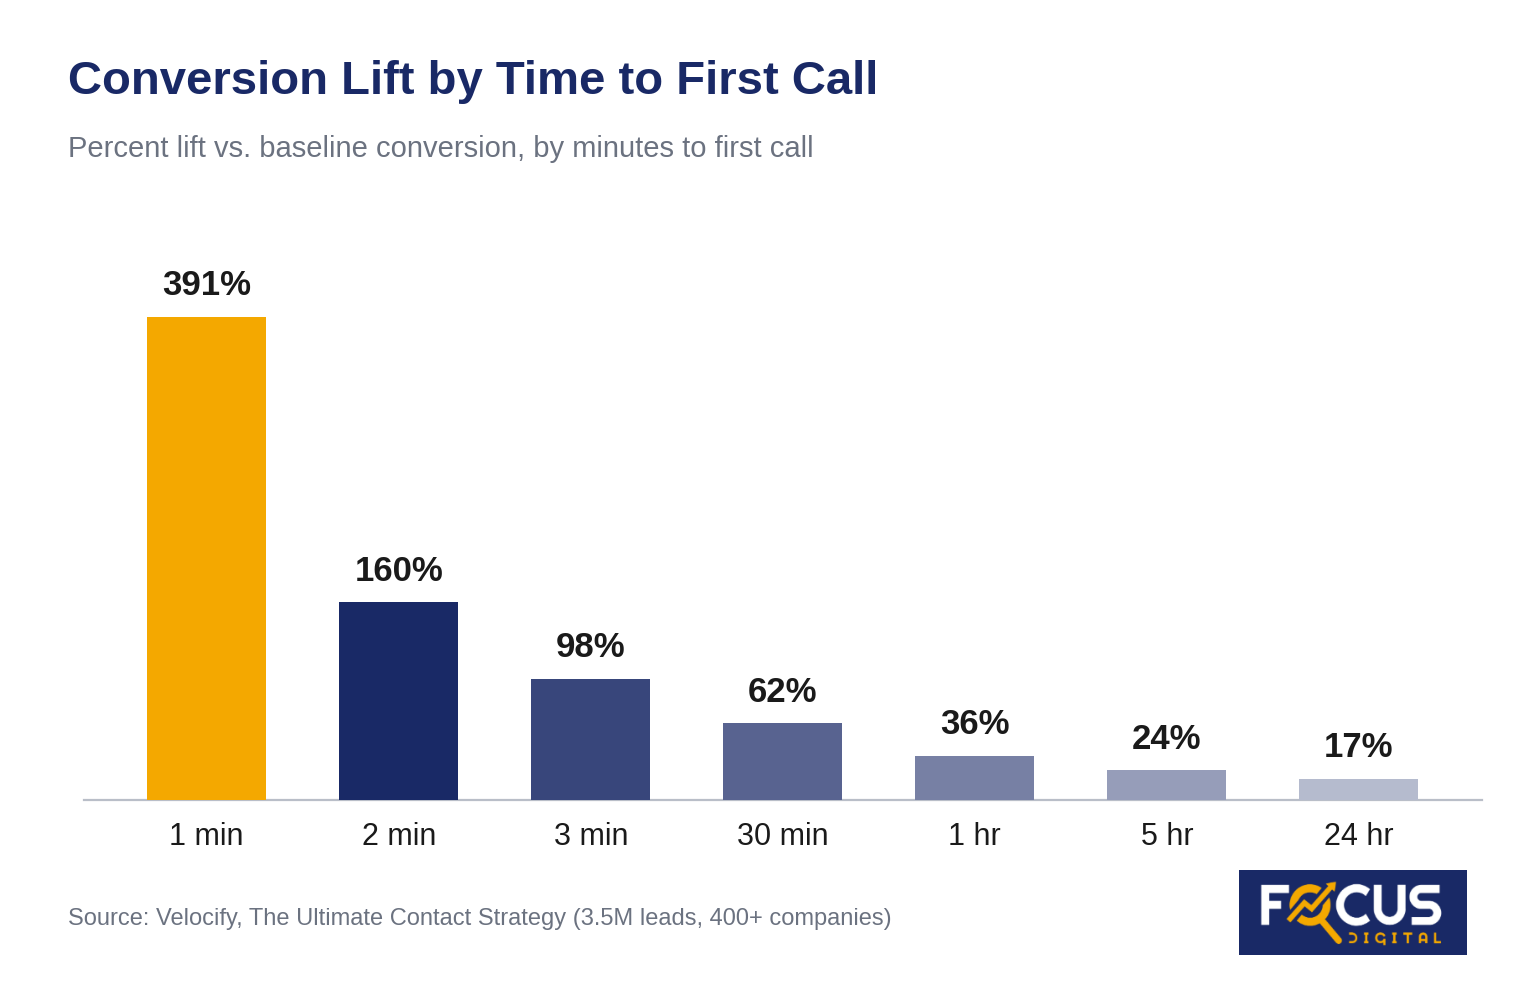
- A callback inside the first minute lifts conversion 391% against baseline, and 75% of that advantage disappears by minute three.
- Legal services strands $41,212 of every $64,900 it spends on 100 inquiries at today’s non-response rate.
Average Speed to Lead by Industry
Only a handful of verticals carry a sample large enough to trust. Legal services and automotive retail publish annual audits, while home services and residential construction rest on one-off secret-shopper studies.
Our data indicates the gap between the fastest and slowest verticals stretches from minutes into days.
| Industry | First-Response Benchmark | Replied Within 5 Minutes | Never Replied | Study Sample |
|---|---|---|---|---|
| Legal Services | 13 minutes (median) | 25% within 5 min | 26% | 1,333 firms, 2025 |
| Automotive Retail | 55%+ within 15 minutes (top brands) | 51% within 15 min (multi-channel) | 14% | 3,290 dealerships, 2026 |
| Real Estate | 39 min median, 8 hr 17 min average | 9% within 5 min (74 brokerages) | 47% | 100+ shops, 2024 |
| B2B SaaS | 1 day 5 hr 17 min average | 17.2% within 2 min | 63.5% | 1,000 companies, 2024 |
| Home Services | 2 min 8 sec fastest, 5 days 19 hr slowest | 5% within 5 min | 40% | 466 companies, 2018 |
| Residential Construction | No personalized email within 5 min | 0% within 5 min (email) | 24% sent no email | 50 builders, 2025 |
- Legal services leads because case value pays for a staffed intake desk, and a single legal lead costs $649 to acquire.
- Home services posts the worst record on file, with 95% of contractors missing the five-minute window.
What Every Minute of Delay Costs
One dataset still anchors the per-minute math, drawn from 3.5 million leads across more than 400 companies, and its curve starts falling the moment minute one ends. The table below tracks conversion lift against baseline as the clock runs.
KEY INSIGHTS:
- Minute one carries a 391% lift and minute three carries 98%, so 75% of the advantage evaporates inside 120 seconds.
- Every window past the first hour lands between 17% and 36%, so a same-day callback performs almost like a next-day one.
The Odds Behind the Clock
Conversion lift prices the revenue at stake, while contact and qualification odds answer whether the conversation happens at all. Three datasets spanning 2007 through 2021 agree on the shape of that decline, and our analysis below compares the decisive windows.| Comparison | Effect on Odds | Underlying Sample |
|---|---|---|
| Contact odds, 5 minutes vs. 30 minutes | 100 times higher | 15,000 leads, 2007 |
| Qualification odds, 5 minutes vs. 30 minutes | 21 times higher | 15,000 leads, 2007 |
| Qualification odds, 1 hour vs. 1–2 hours | 7 times higher | 2,241 companies, 2011 |
| Qualification odds, 1 hour vs. 24+ hours | 60 times higher | 2,241 companies, 2011 |
| Conversion odds, 5 minutes vs. 6+ minutes | 8 times higher | 5.7 million leads, 2021 |
- The 100x and 21x figures rest on six companies from 2007, so weight the 2011 audit of 2,241 companies more heavily.
- Platform data from 2021 puts the practical break point at six minutes, a cleaner service-level target than five.
What Slow Response Costs in Acquisition Spend
Acquisition spend converts the delay into a number an owner can act on. We multiplied blended cost per lead by 100 inquiries, then applied the 63.5% non-response rate from the most recent audit to isolate the spend that buys nothing. The table below carries that math across seven industries.| Industry | Blended Cost Per Lead | Cost of 100 Leads | Spend Stranded at 63.5% Non-Response |
|---|---|---|---|
| Financial Services | $653 | $65,300 | $41,466 |
| Legal Services | $649 | $64,900 | $41,212 |
| Manufacturing | $553 | $55,300 | $35,116 |
| IT and Managed Services | $503 | $50,300 | $31,940 |
| Healthcare | $361 | $36,100 | $22,924 |
| B2B SaaS | $237 | $23,700 | $15,050 |
| Construction | $227 | $22,700 | $14,414 |
- Financial services and legal services each spend more than $41,000 per 100 leads, more than the salary of the coordinator who would have answered.
- Construction and B2B SaaS carry the lowest exposure per lead, though volume multiplies the same percentage across far more forms.
Further Reading
- Average Sales Call Conversion Rate by Industry: 2026 Report
- Average Touchpoints per Purchase by Industry: 2026 Report
- Customer Acquisition Cost Trends: 2026 Report
- Average Cold Call Conversion Rate by Industry, 2026
Sources
- The Short Life of Online Sales Leads
- Lead Response Management Study
- 2014 Lead Response Report
- Is Your Lead Management Leaking? We Tested 433 Companies
- We Tested Lead Response Times of 1,000 B2B Sales Teams
- 2025 Lead Form Response Time Study
- 2026 Pied Piper Internet Lead Effectiveness Auto Industry Study
- Secret Shopping: 47% of Online Property Inquiries Are Ignored
- The State of Speed to Lead in Home Services
- 2025 Online Homebuyer Mystery Shop Report
- The Ultimate Contact Strategy
- Lead Response Management 2021
- Average Cost Per Lead by Industry