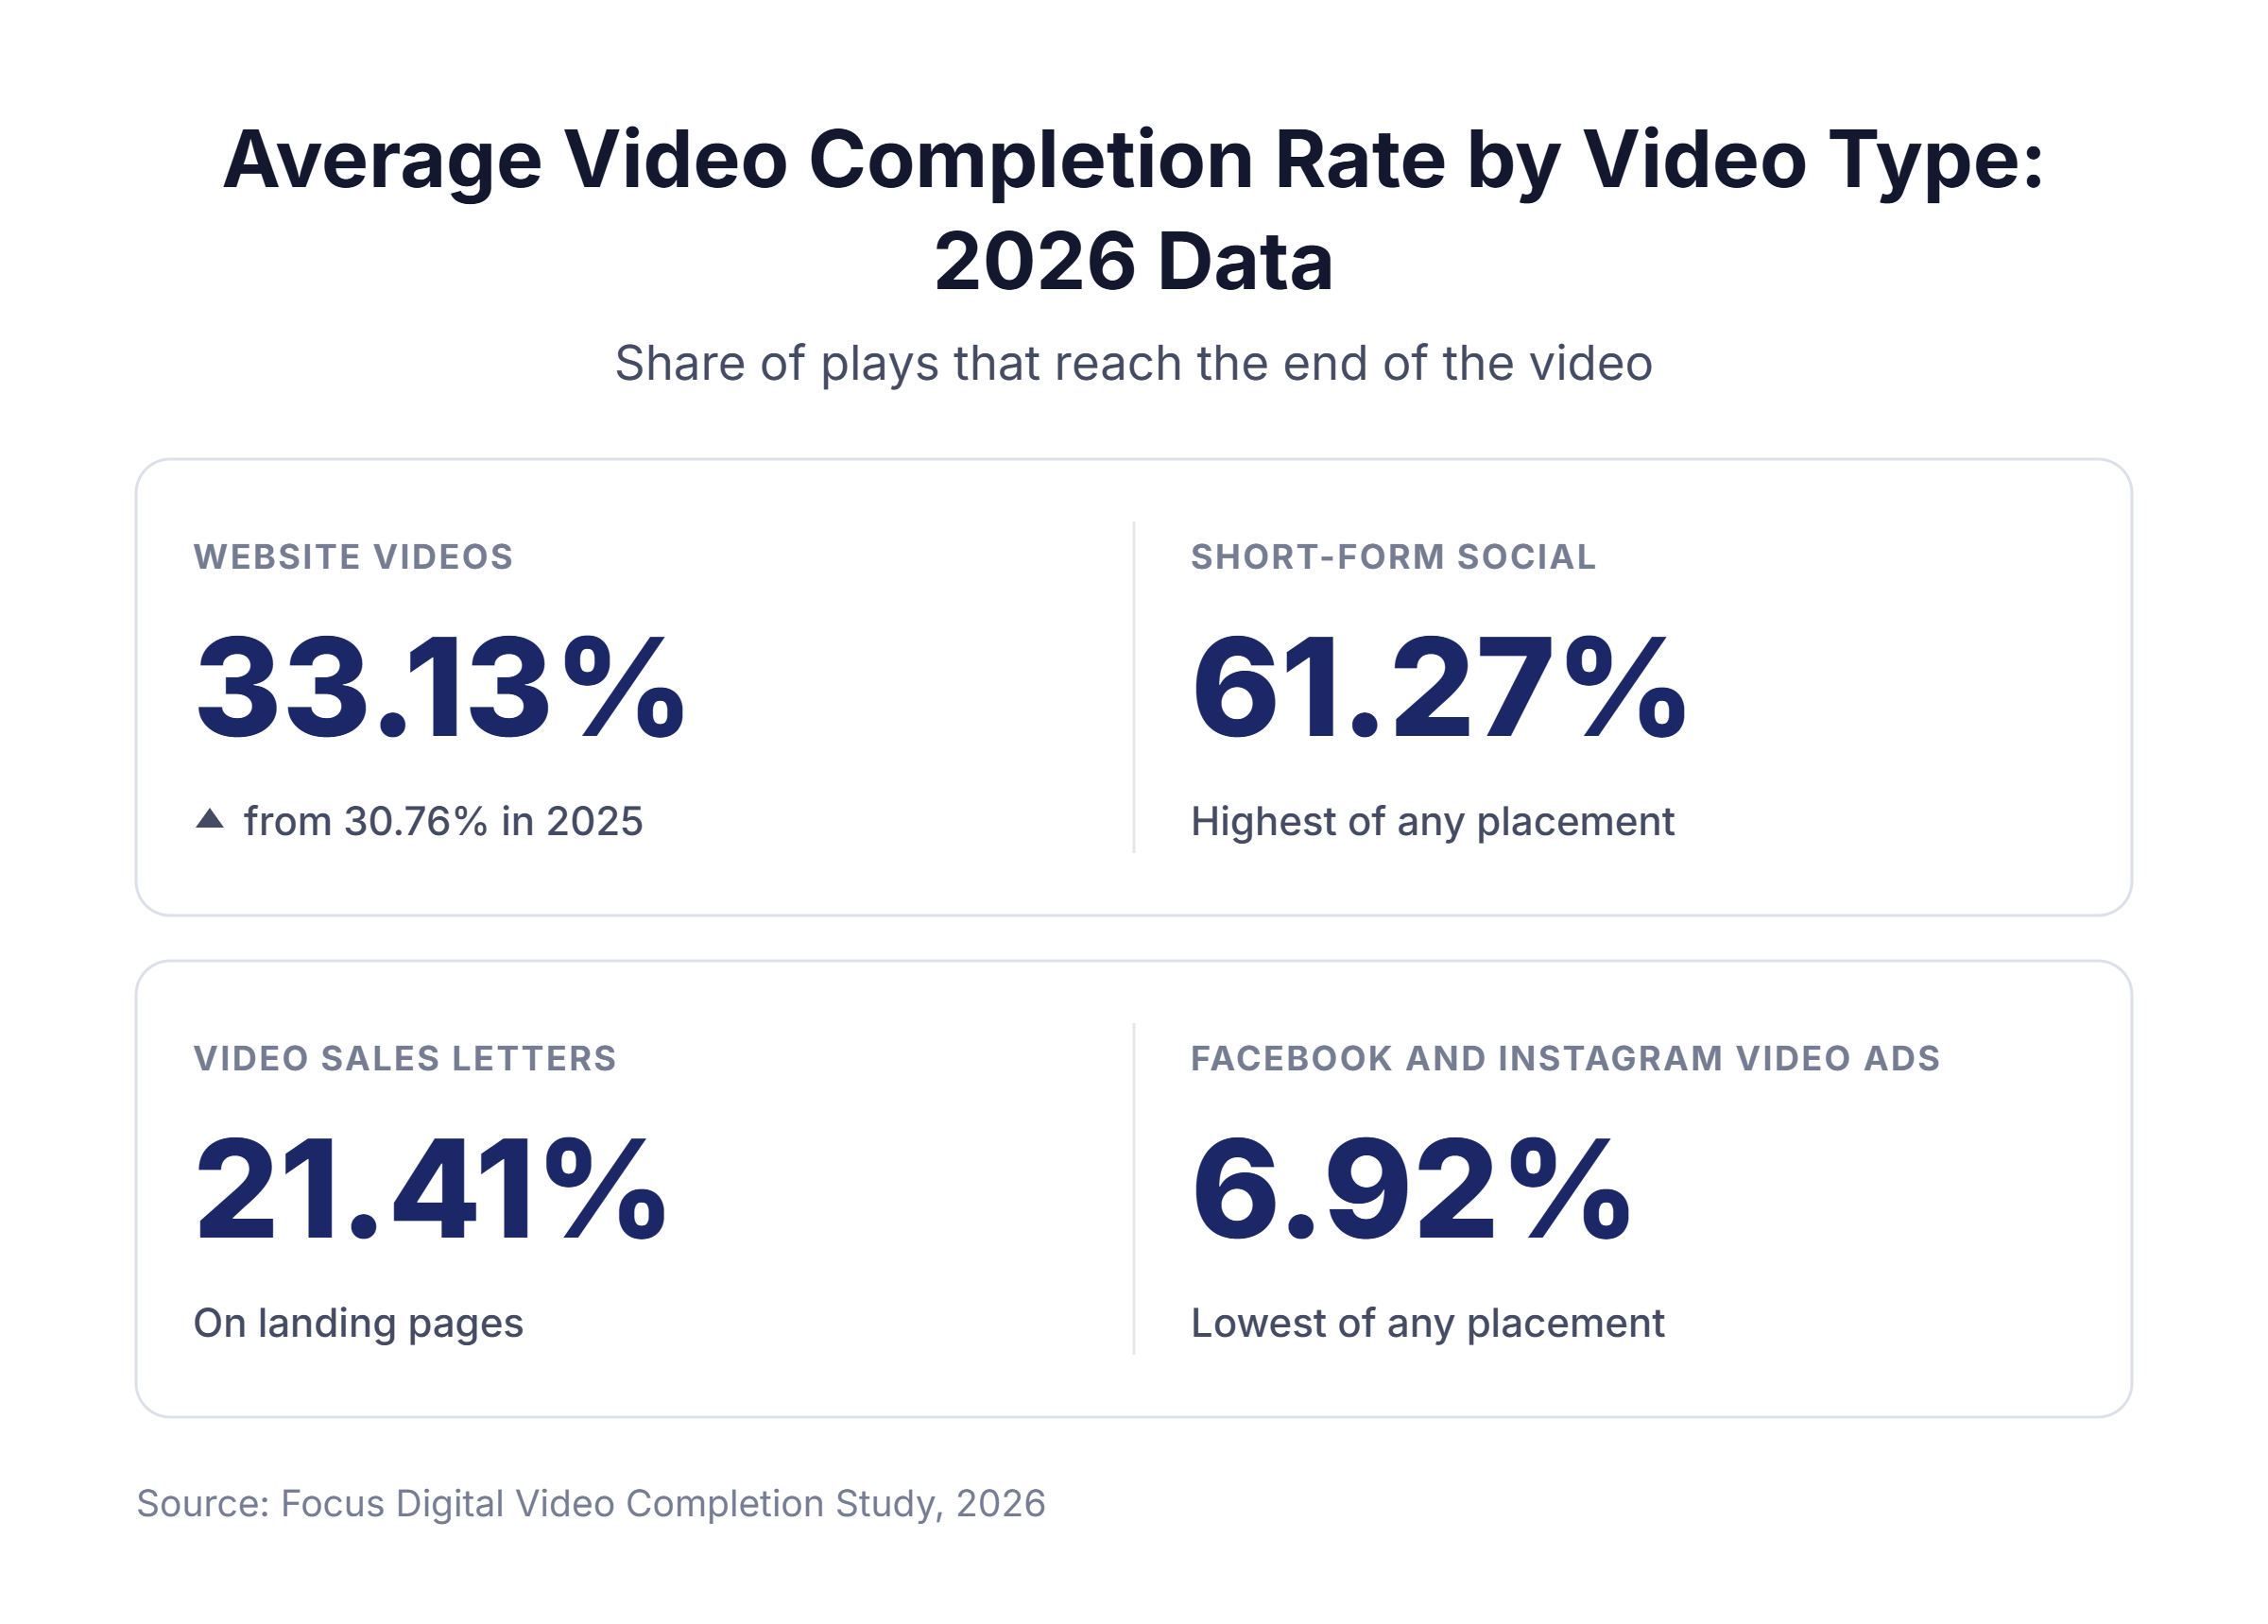
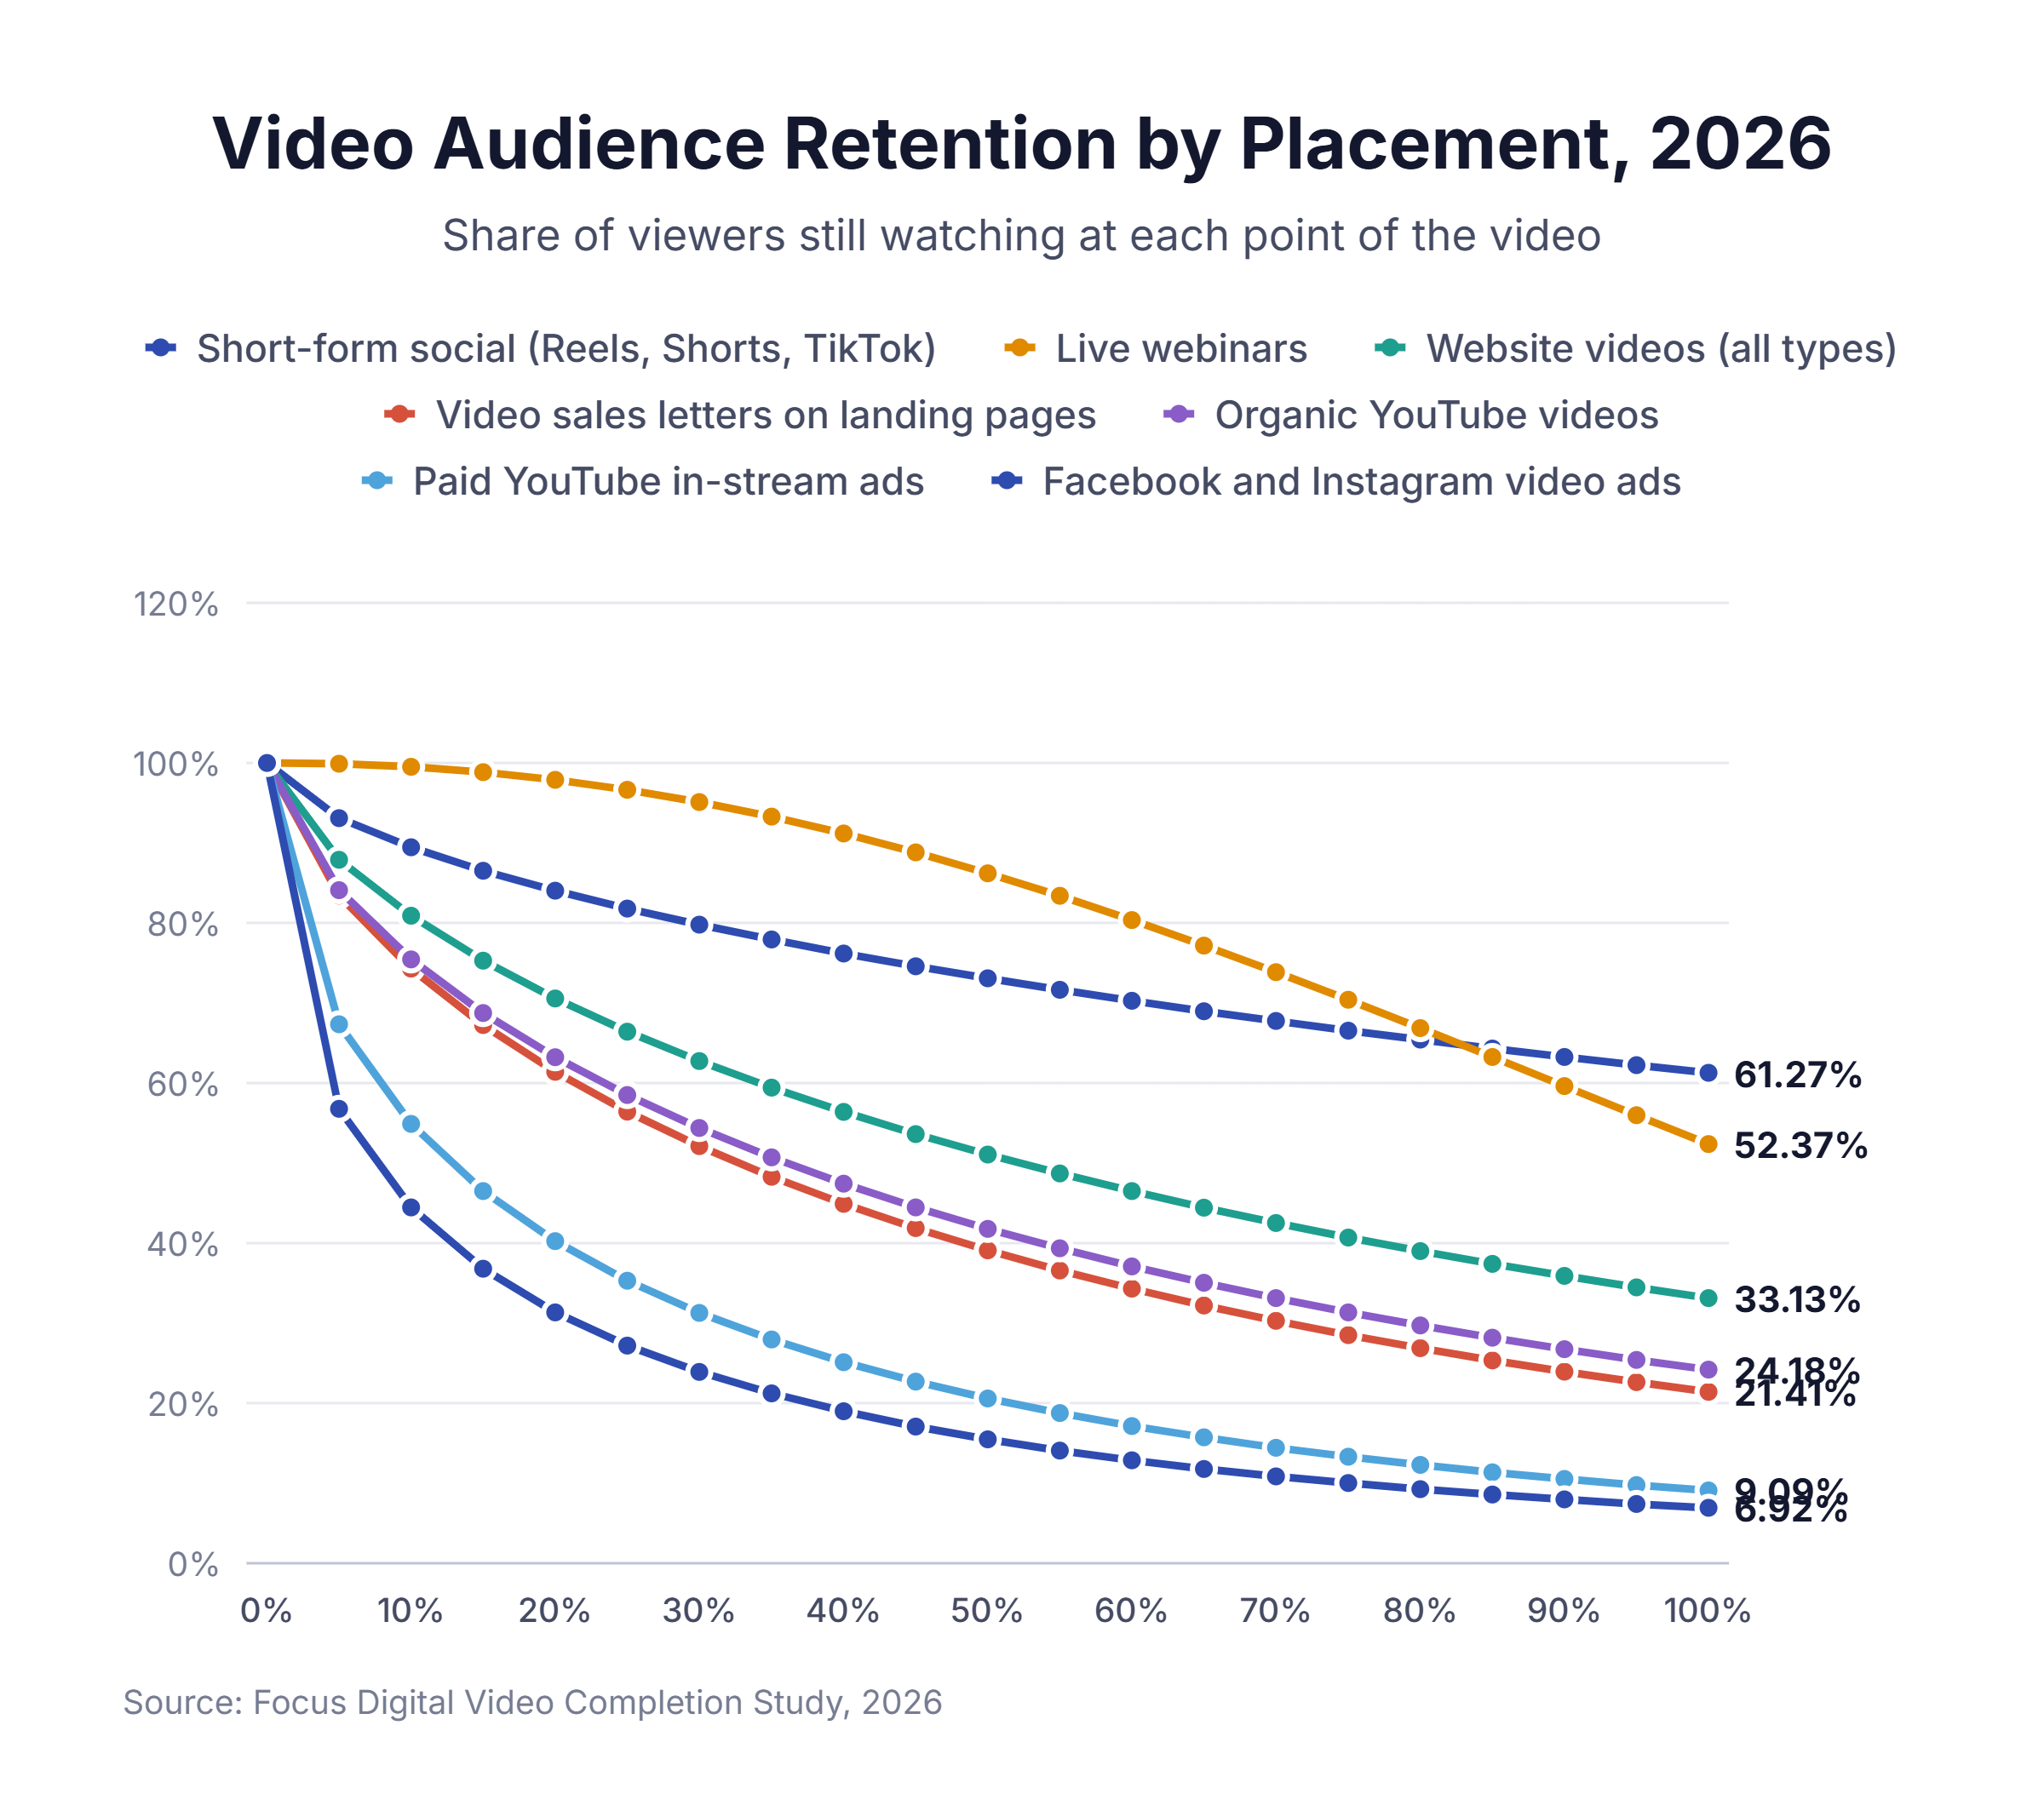
The average video completion rate is 33.13% for videos embedded on business websites, and half of viewers leave before the video reaches the 52.19% mark. Short-form social videos finish at 61.27%, video sales letters at 21.41%, and Facebook and Instagram video ads at 6.92%. We studied video completion and drop-off by placement, video type, sales video style, video length, device, and traffic source.
Key takeaways:
- Website video completion rose 2.37 percentage points in a year, from 30.76% in 2025 to 33.13% in 2026.
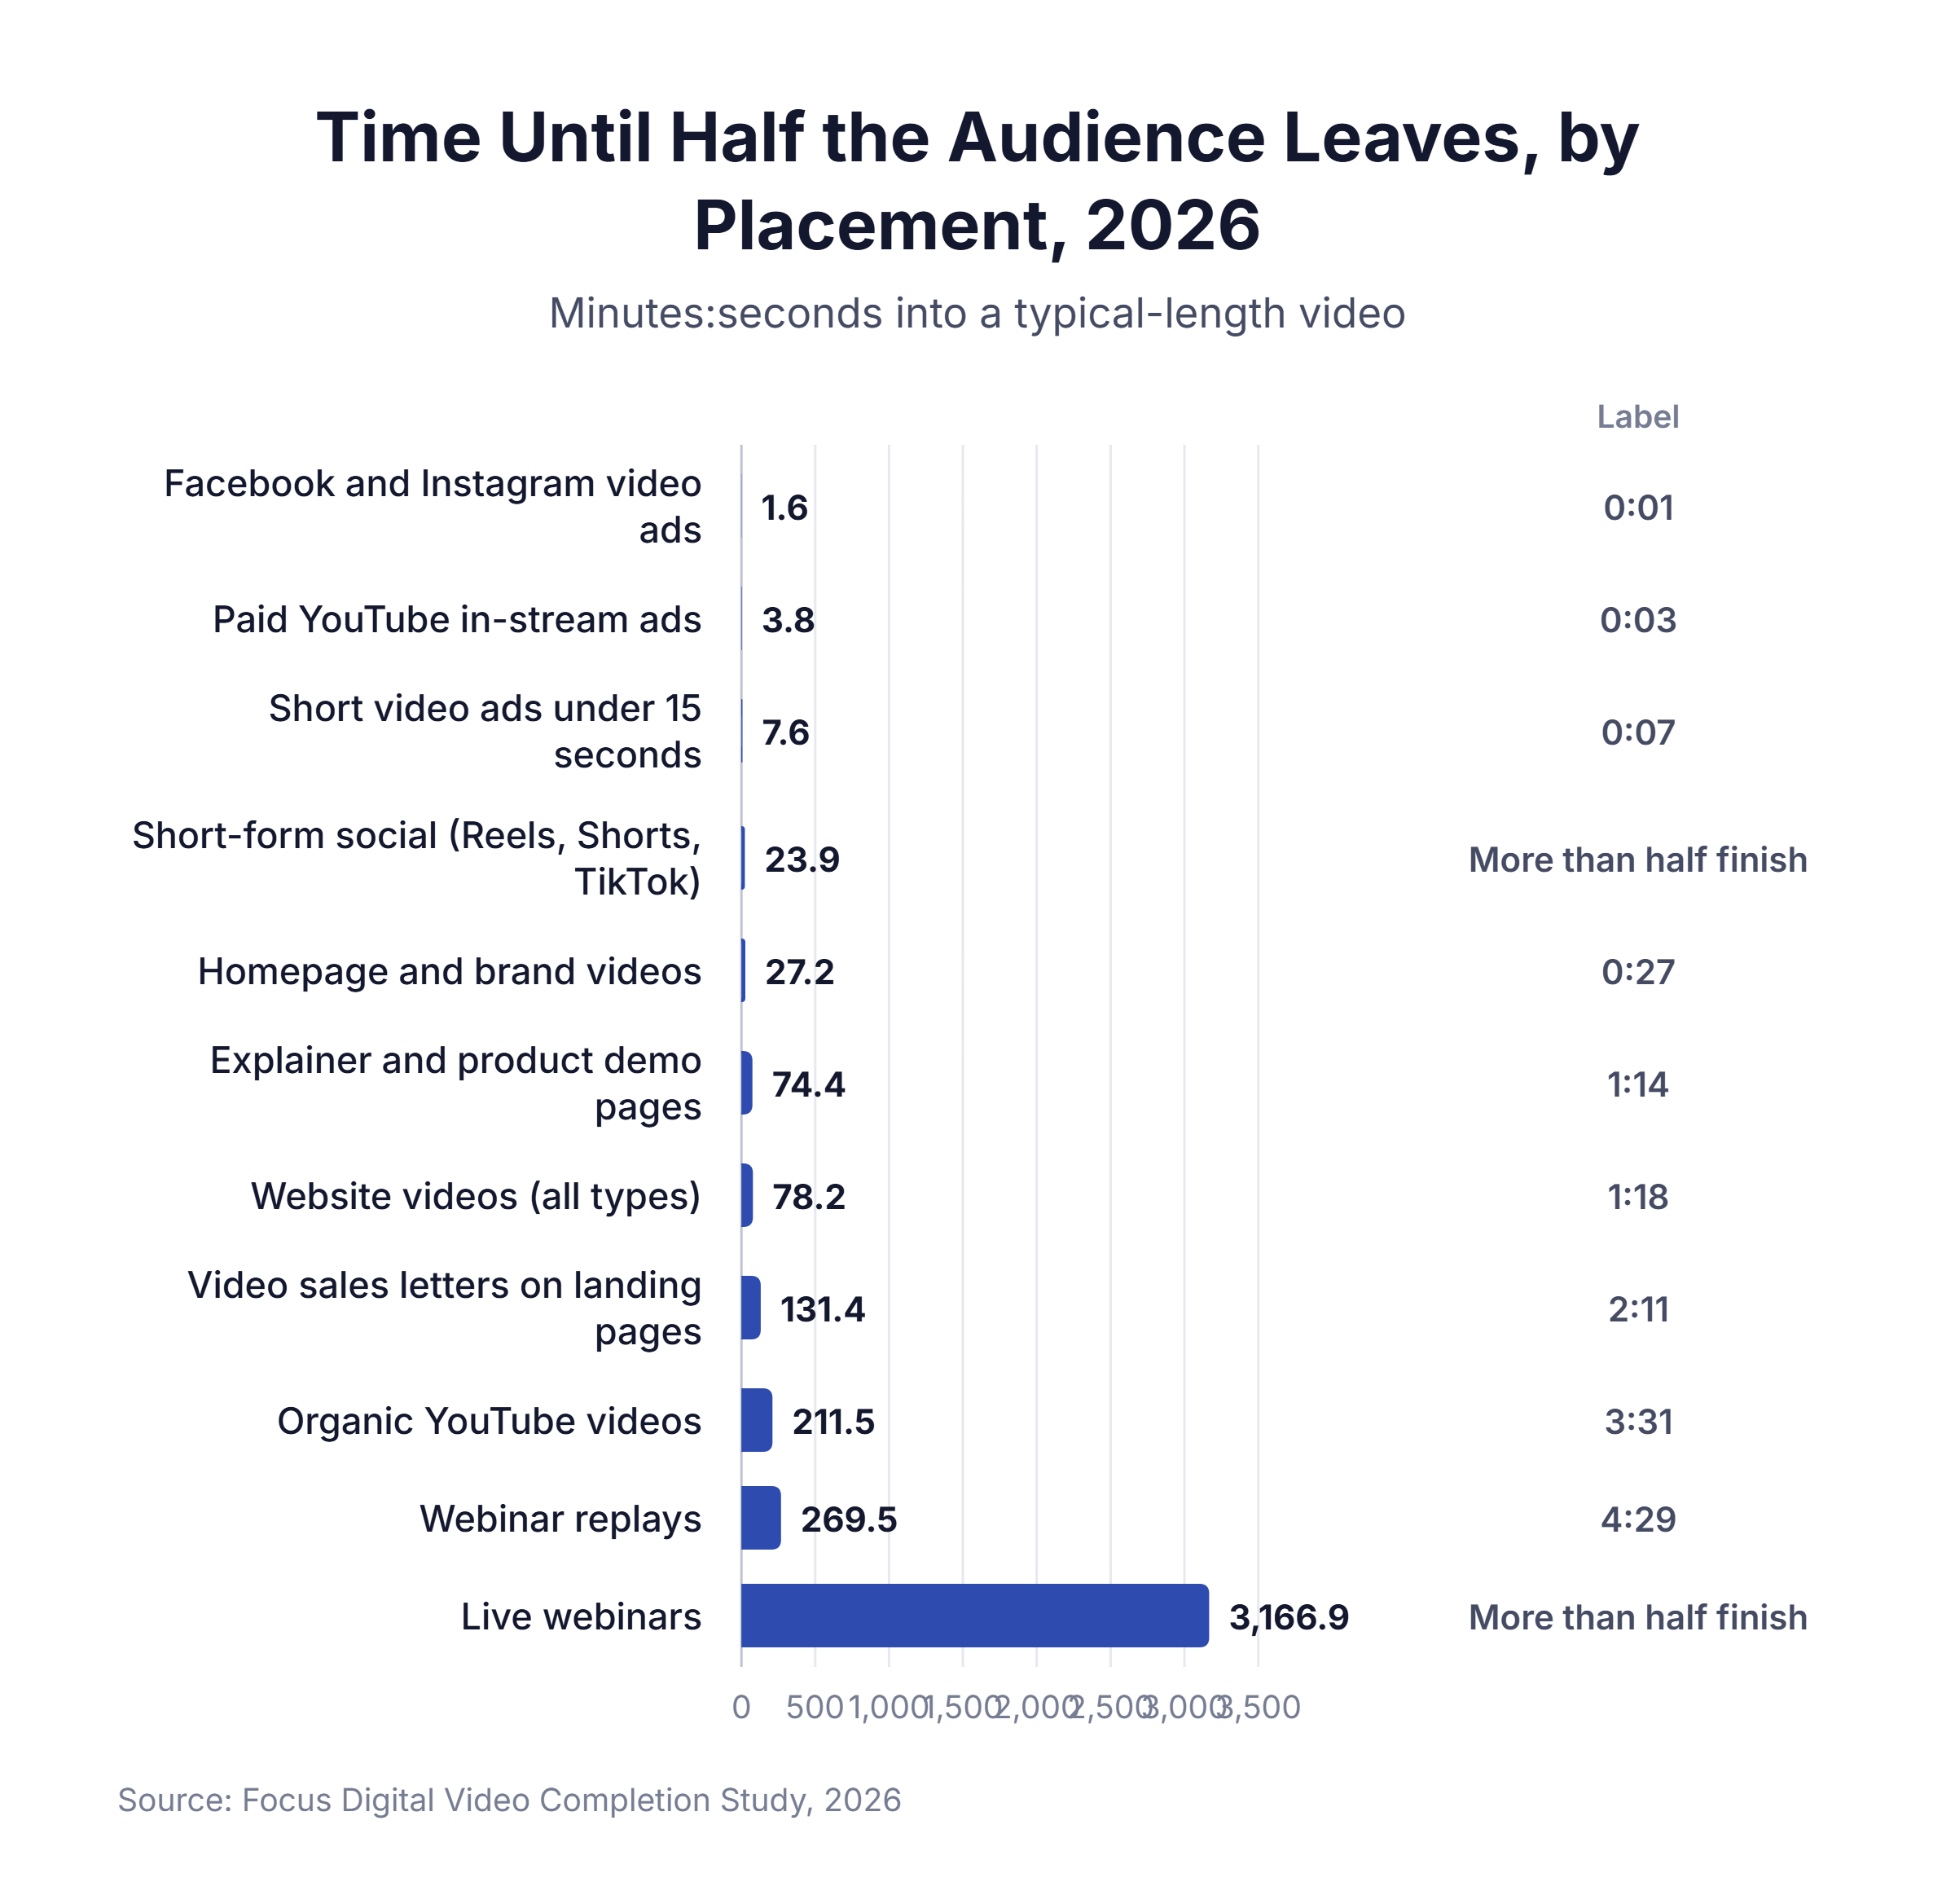
- Half of the people who see a paid YouTube in-stream ad stop watching within 3.8 seconds, before the skip button appears.
- Customer testimonials finish at 42.21%, 2.42 times the rate of founder and brand story videos.
- Half of video sales letter viewers are gone by the 2:11 mark of a 6:42 video.
- Desktop viewers finish website videos 7.84 percentage points more often than mobile viewers.
- Each time a video doubles in length, its completion rate falls about 4.71 percentage points.
Average Video Completion Rate by Placement
Completion ranges from 6.92% for Facebook and Instagram video ads to 61.27% for short-form social videos.
| Placement | Completion rate | Average share watched | Half the audience gone by | Typical length |
|---|---|---|---|---|
| Short-form social (Reels, Shorts, TikTok) | 61.27% | 74.83% | More than half finish | 0:24 |
| Live webinars | 52.37% | 82.74% | More than half finish | 52:47 |
| Website videos (all types) | 33.13% | 54.94% | 1:18 | 2:30 |
| Explainer and product demo pages | 32.87% | 56.83% | 1:14 | 2:13 |
| Short video ads under 15 seconds | 27.22% | 63.23% | 0:07 | 0:12 |
| Organic YouTube videos | 24.18% | 46.73% | 3:31 | 9:47 |
| Video sales letters on landing pages | 21.41% | 44.39% | 2:11 | 6:42 |
| Homepage and brand videos | 17.39% | 38.69% | 0:27 | 1:52 |
| Webinar replays | 13.71% | 27.58% | 4:29 | 52:47 |
| Paid YouTube in-stream ads | 10.03% | 27.17% | 0:03 | 0:30 |
| Facebook and Instagram video ads | 6.92% | 21.47% | 0:01 | 0:22 |
Key findings:
- Autoplay counts every scroller as a viewer. Paid YouTube in-stream ads and Facebook and Instagram ads start playing on their own, so the starting audience includes people who never chose to watch. 64.11% of in-stream ad viewers are gone before the 25% mark.
- Viewers who press play stay longer. Website visitors who click play on a video finish it more than three times as often as people served a YouTube in-stream ad.
- Live attendance creates commitment. Live webinar attendees finish 3.81 times as often as people who watch the replay. We believe the scheduled time and the chance to ask questions keep live viewers in their seats.
- Short-form social is the only placement where most viewers finish. A 24-second Reel or Short ends before most viewers decide to leave.
Average Video Completion Rate by Video Type on Websites
How-to tutorials, testimonials, and facility tours hold website viewers best.
| Video type | Completion rate | Average share watched | Half the audience gone by | Typical length |
|---|---|---|---|---|
| Customer testimonial | 42.21% | 49.42% | 0:34 | 1:37 |
| Facility tour | 39.15% | 66.69% | 2:00 | 2:38 |
| How-to tutorial | 38.79% | 55.64% | 1:33 | 2:47 |
| Explainer or product demo | 32.87% | 56.83% | 1:14 | 2:13 |
| Press feature | 21.47% | 43.89% | 1:03 | 3:21 |
| Video sales letter | 21.41% | 44.39% | 2:11 | 6:42 |
| Founder or brand story | 17.39% | 38.69% | 0:27 | 1:52 |
| Webinar replay | 13.71% | 27.58% | 4:29 | 52:47 |
| Background loop | 0.84% | 20.83% | 0:06 | 0:43 |
Key findings:
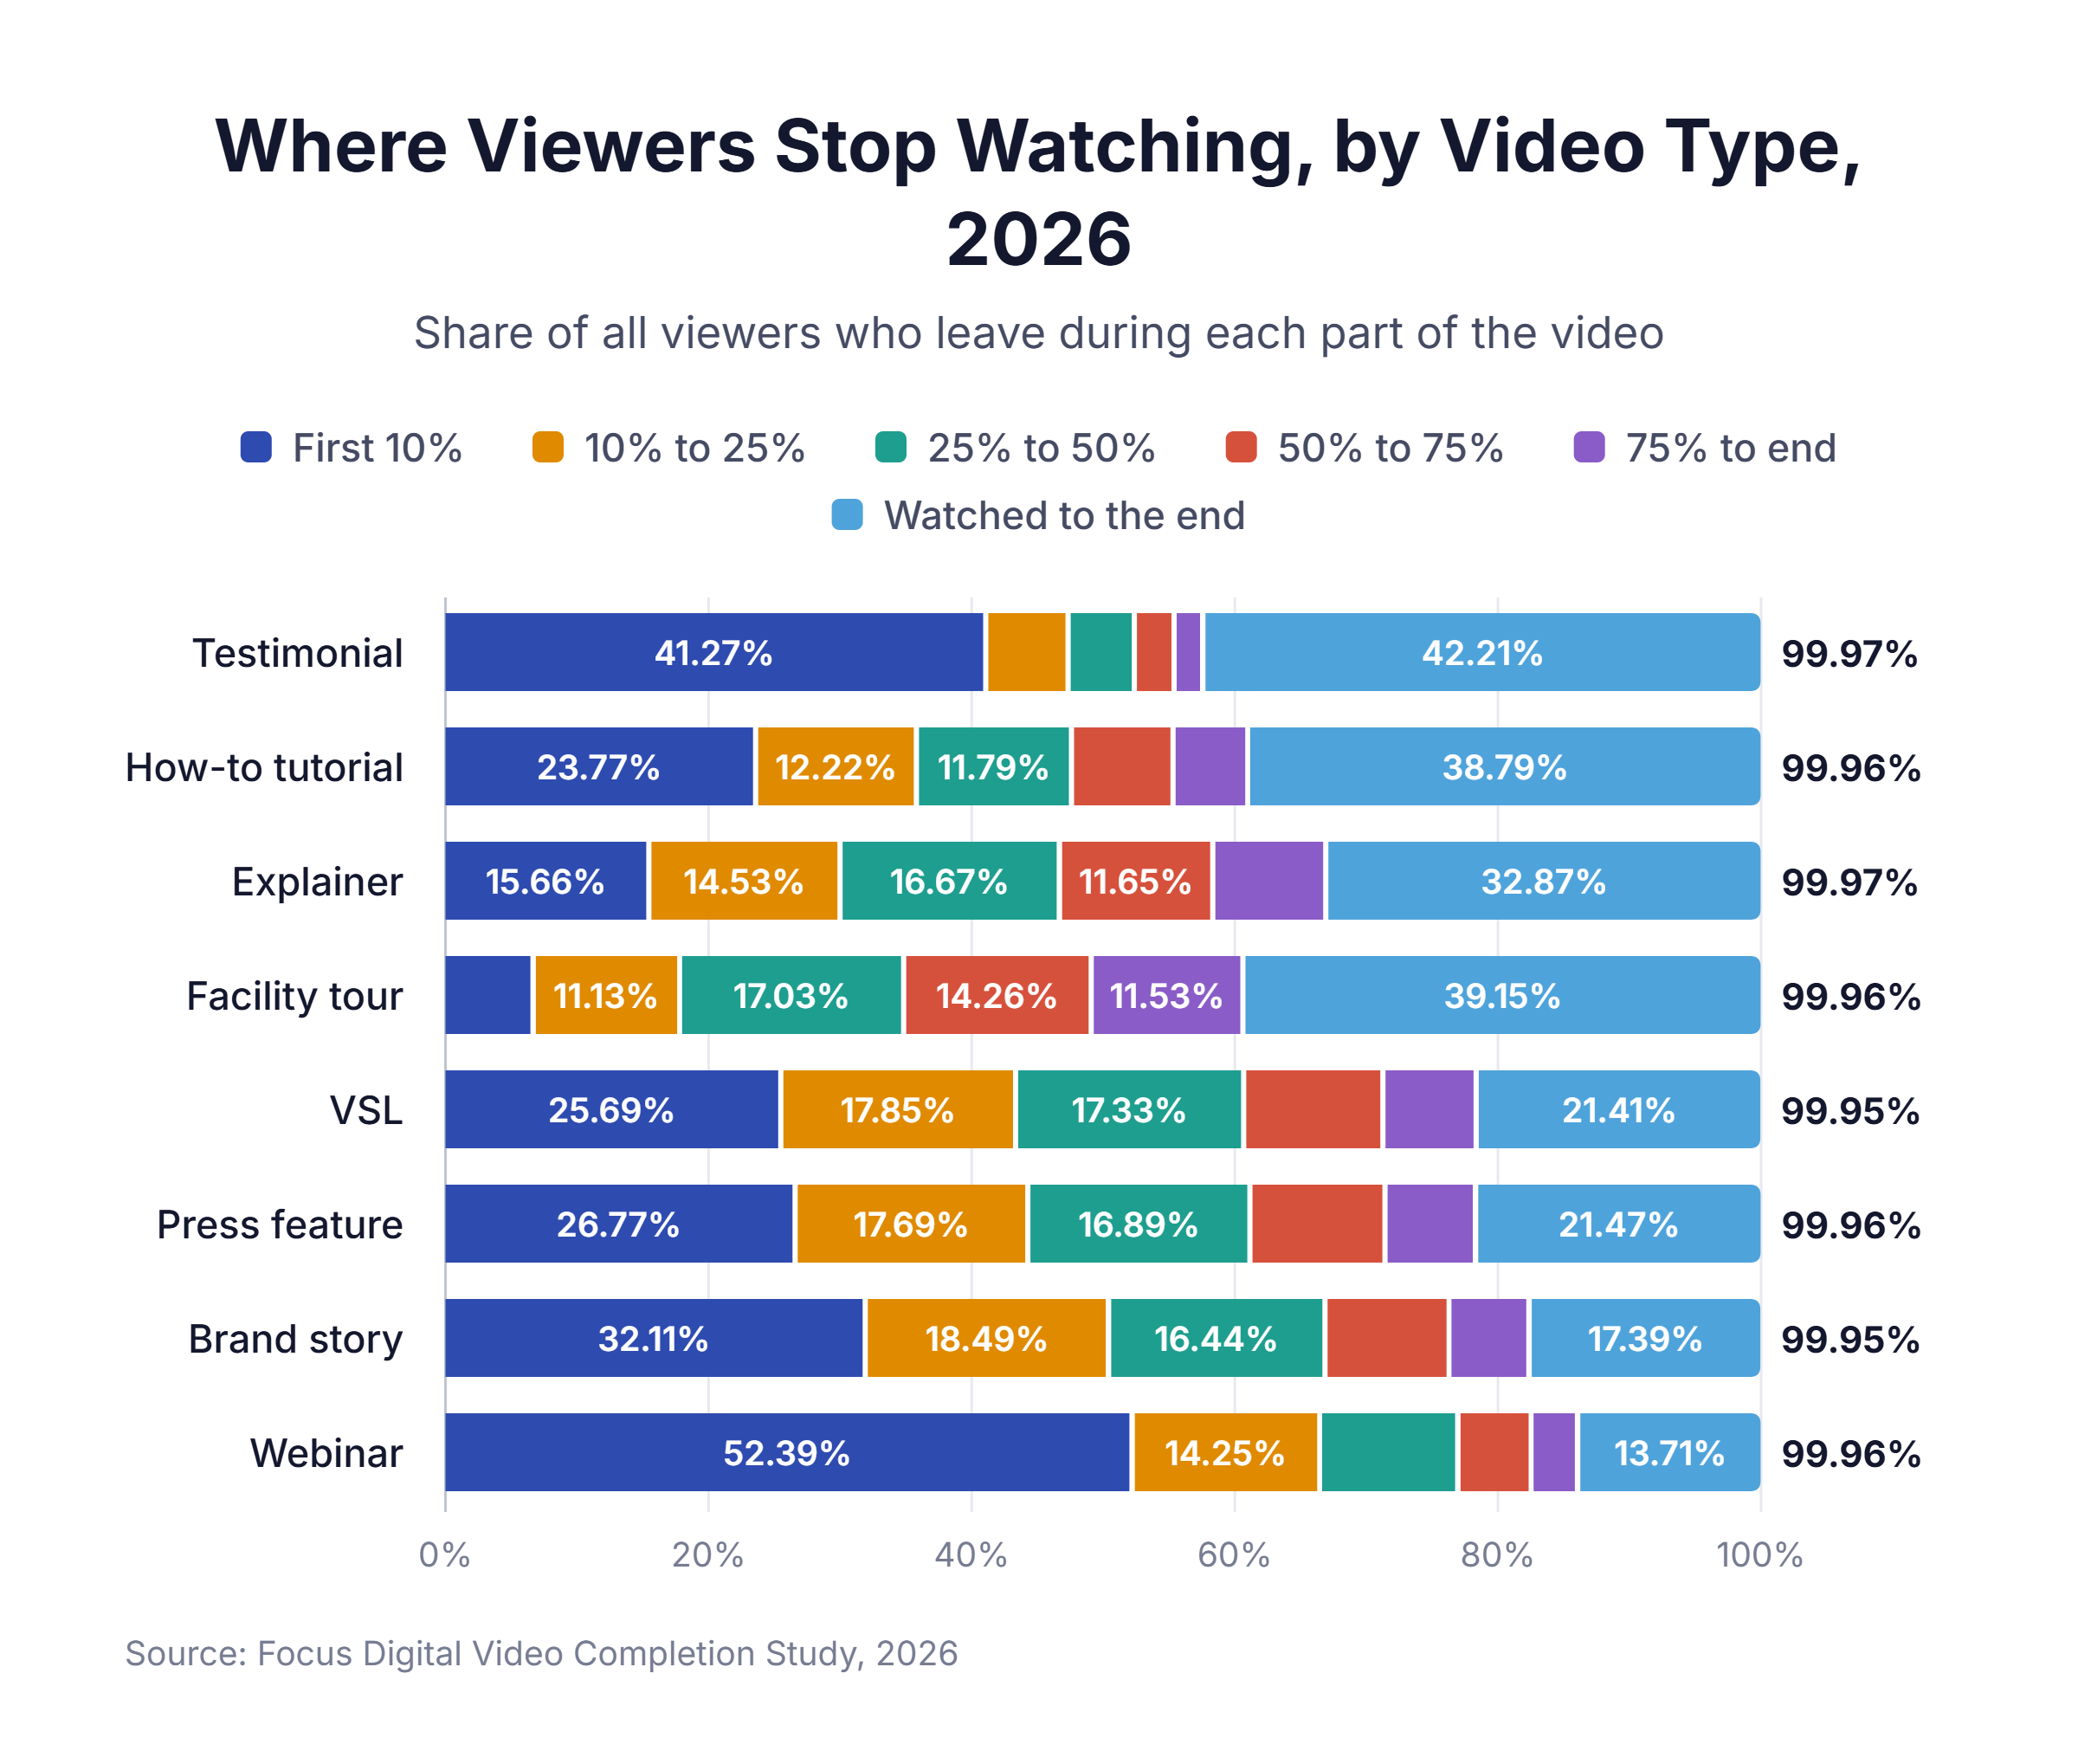
- Testimonials lose viewers fast, then keep them. 41.27% of testimonial viewers leave in the first 10% of the video, and only 16.49% leave over the rest. Viewers who stay past the opening line watch a real customer to the end.
- Brand stories lose a third of viewers before the story starts. 32.11% of brand story viewers leave in the first 10%. Our read is that a slow opening with music and logos gives viewers no reason to stay.
- Background loops are decoration. Muted hero loops autoplay on page load, and only 0.84% of loop plays reach the end. A loop sets a mood, and a playable video with a clear subject earns the watch time.
Website Sales Video Completion Rate by Style
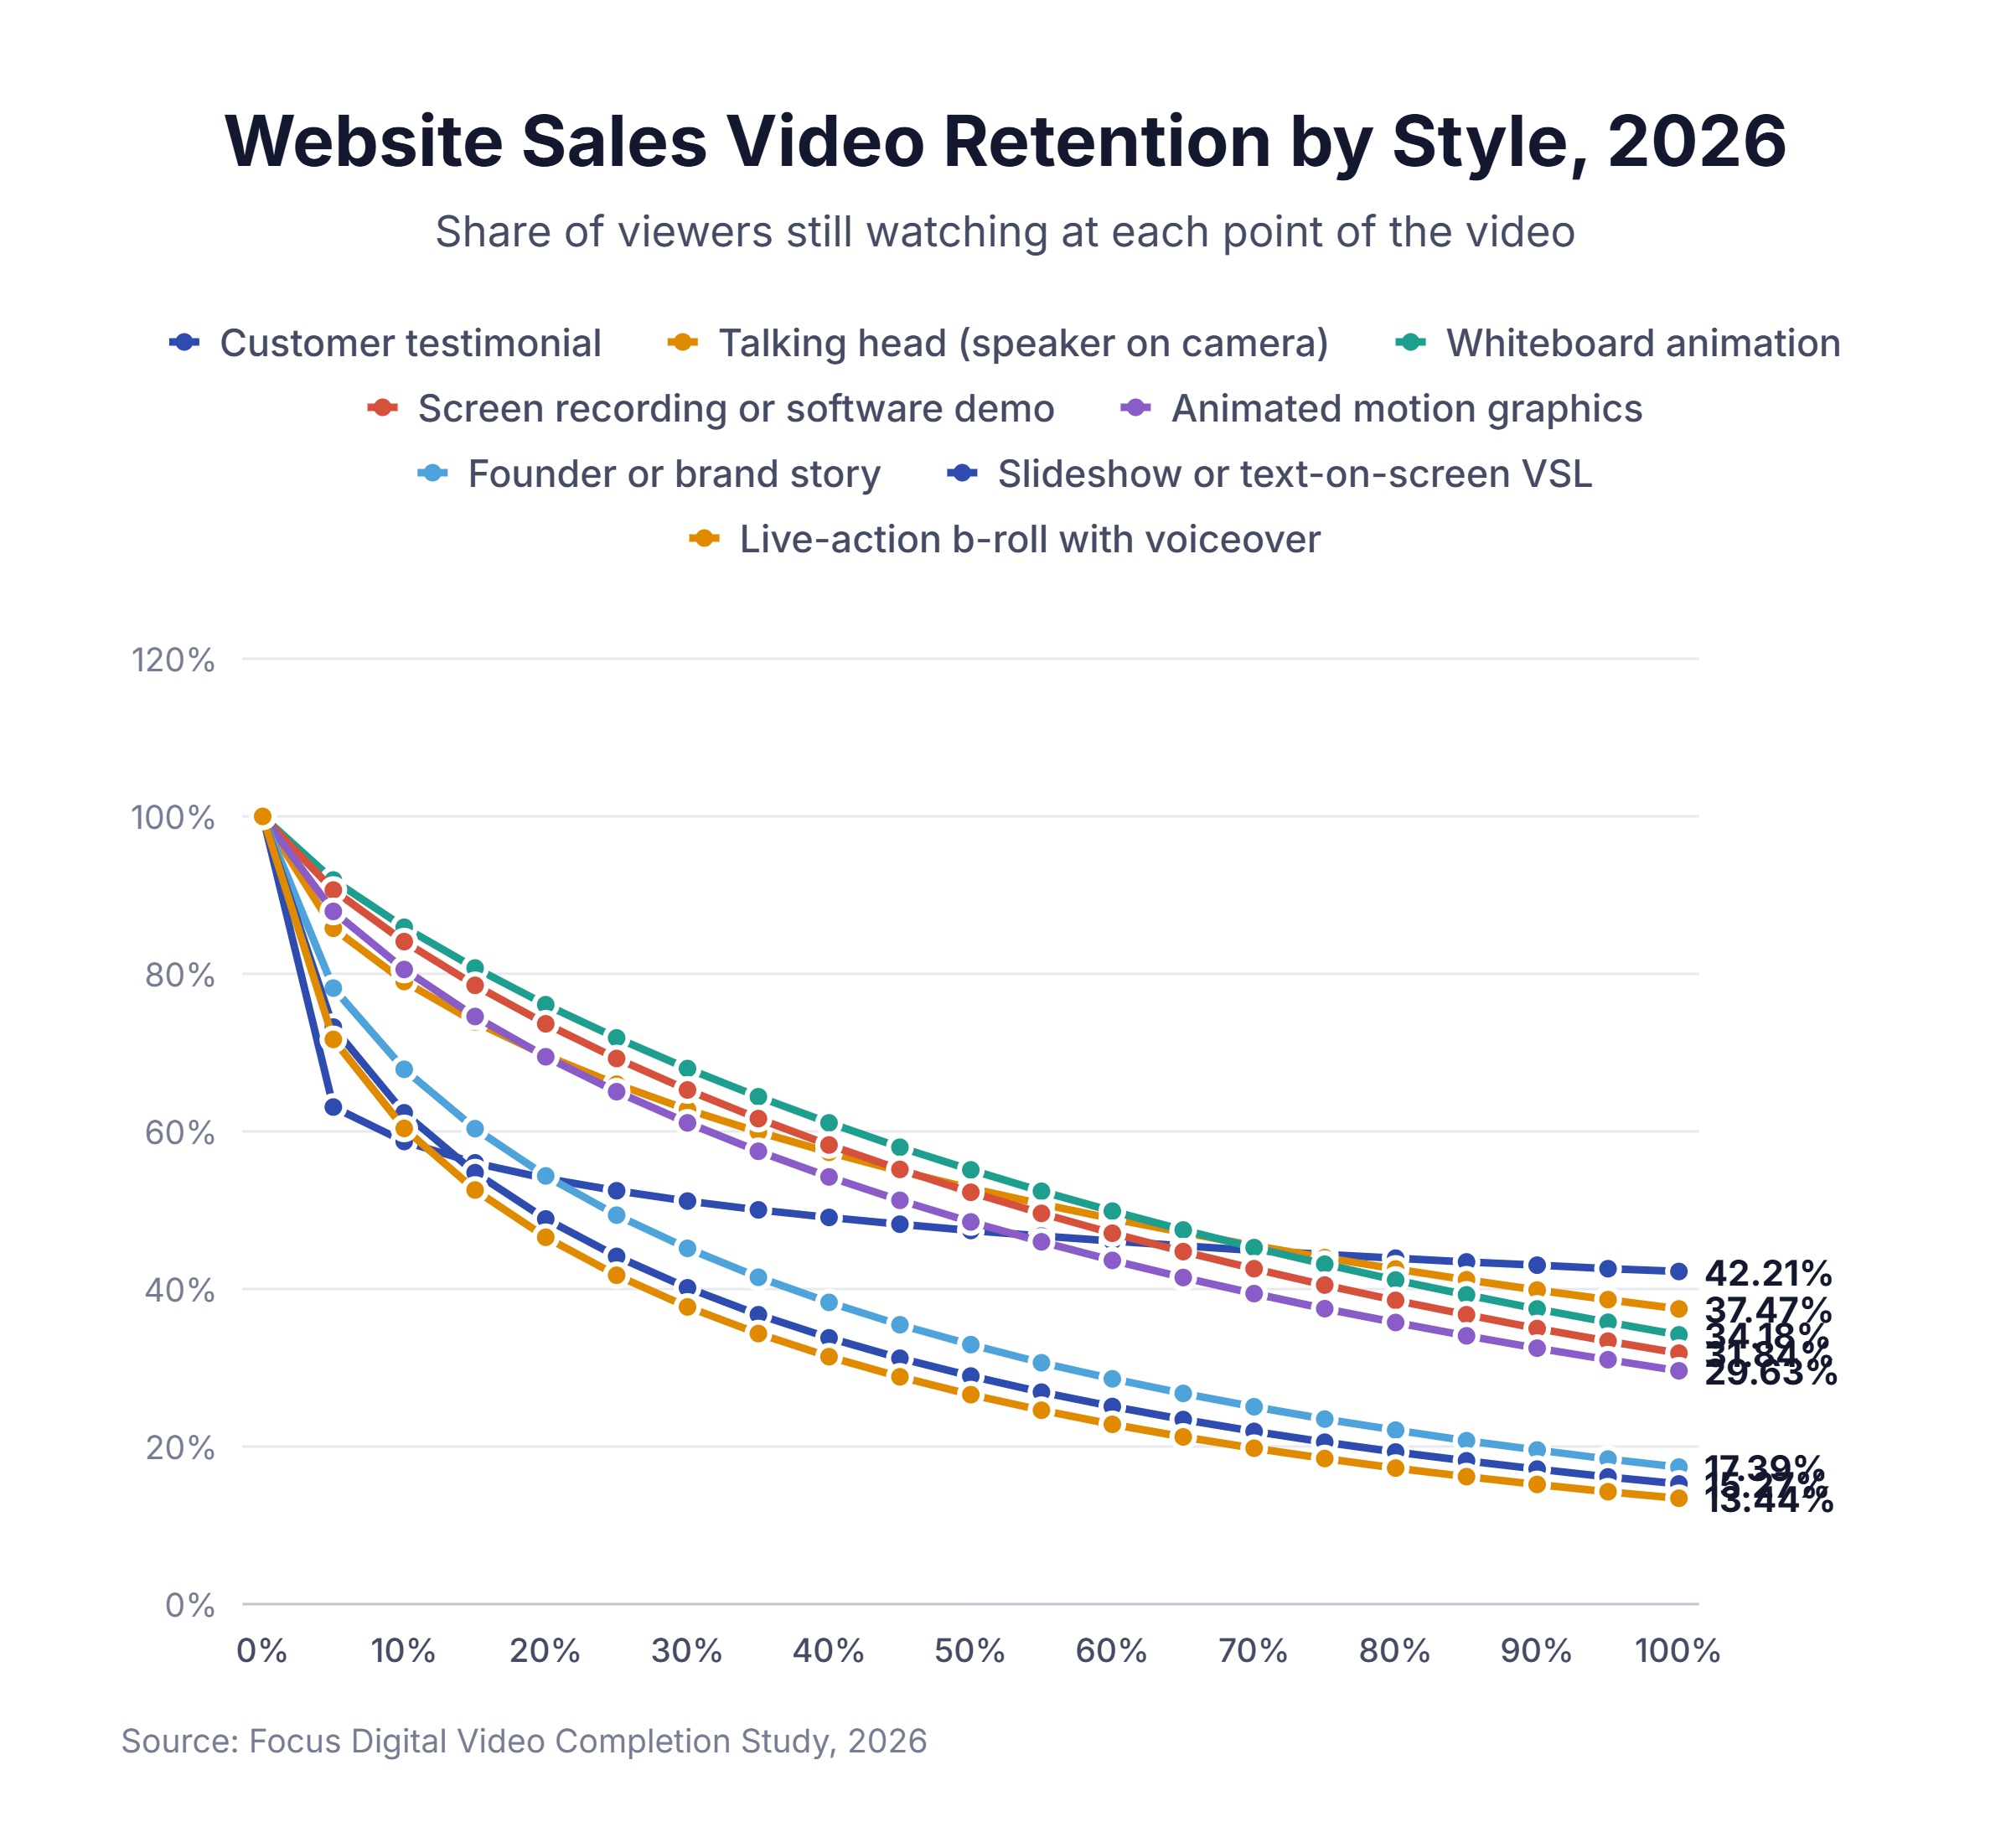
Videos with a real person on camera finish more often than videos built from stock footage or text.
| Sales video style | Completion rate | Average share watched | Half the audience gone by | Typical length |
|---|---|---|---|---|
| Customer testimonial | 42.21% | 49.42% | 0:34 | 1:37 |
| Talking head (speaker on camera) | 37.47% | 56.35% | 2:16 | 4:00 |
| Whiteboard animation | 34.18% | 58.56% | 1:11 | 2:00 |
| Screen recording or software demo | 31.84% | 56.09% | 1:21 | 2:30 |
| Animated motion graphics | 29.63% | 52.73% | 0:42 | 1:30 |
| Founder or brand story | 17.39% | 38.69% | 0:27 | 1:52 |
| Slideshow or text-on-screen VSL | 15.27% | 34.77% | 1:31 | 8:00 |
| Live-action b-roll with voiceover | 13.44% | 32.65% | 0:17 | 1:40 |
Key findings:
- A face on screen holds attention. Talking-head videos run 2.4 times as long as b-roll videos with a voiceover, and viewers still finish them 24.03 percentage points more often.
- Whiteboard animation beats motion graphics. Whiteboard videos finish 4.55 percentage points more often. We think viewers stay to see what the hand draws next.
- Text-on-screen VSLs lose viewers early. Half of slideshow VSL viewers leave by 1:31 of an eight-minute video, long before most of these videos reach the offer.
Video Completion Rate by Video Length
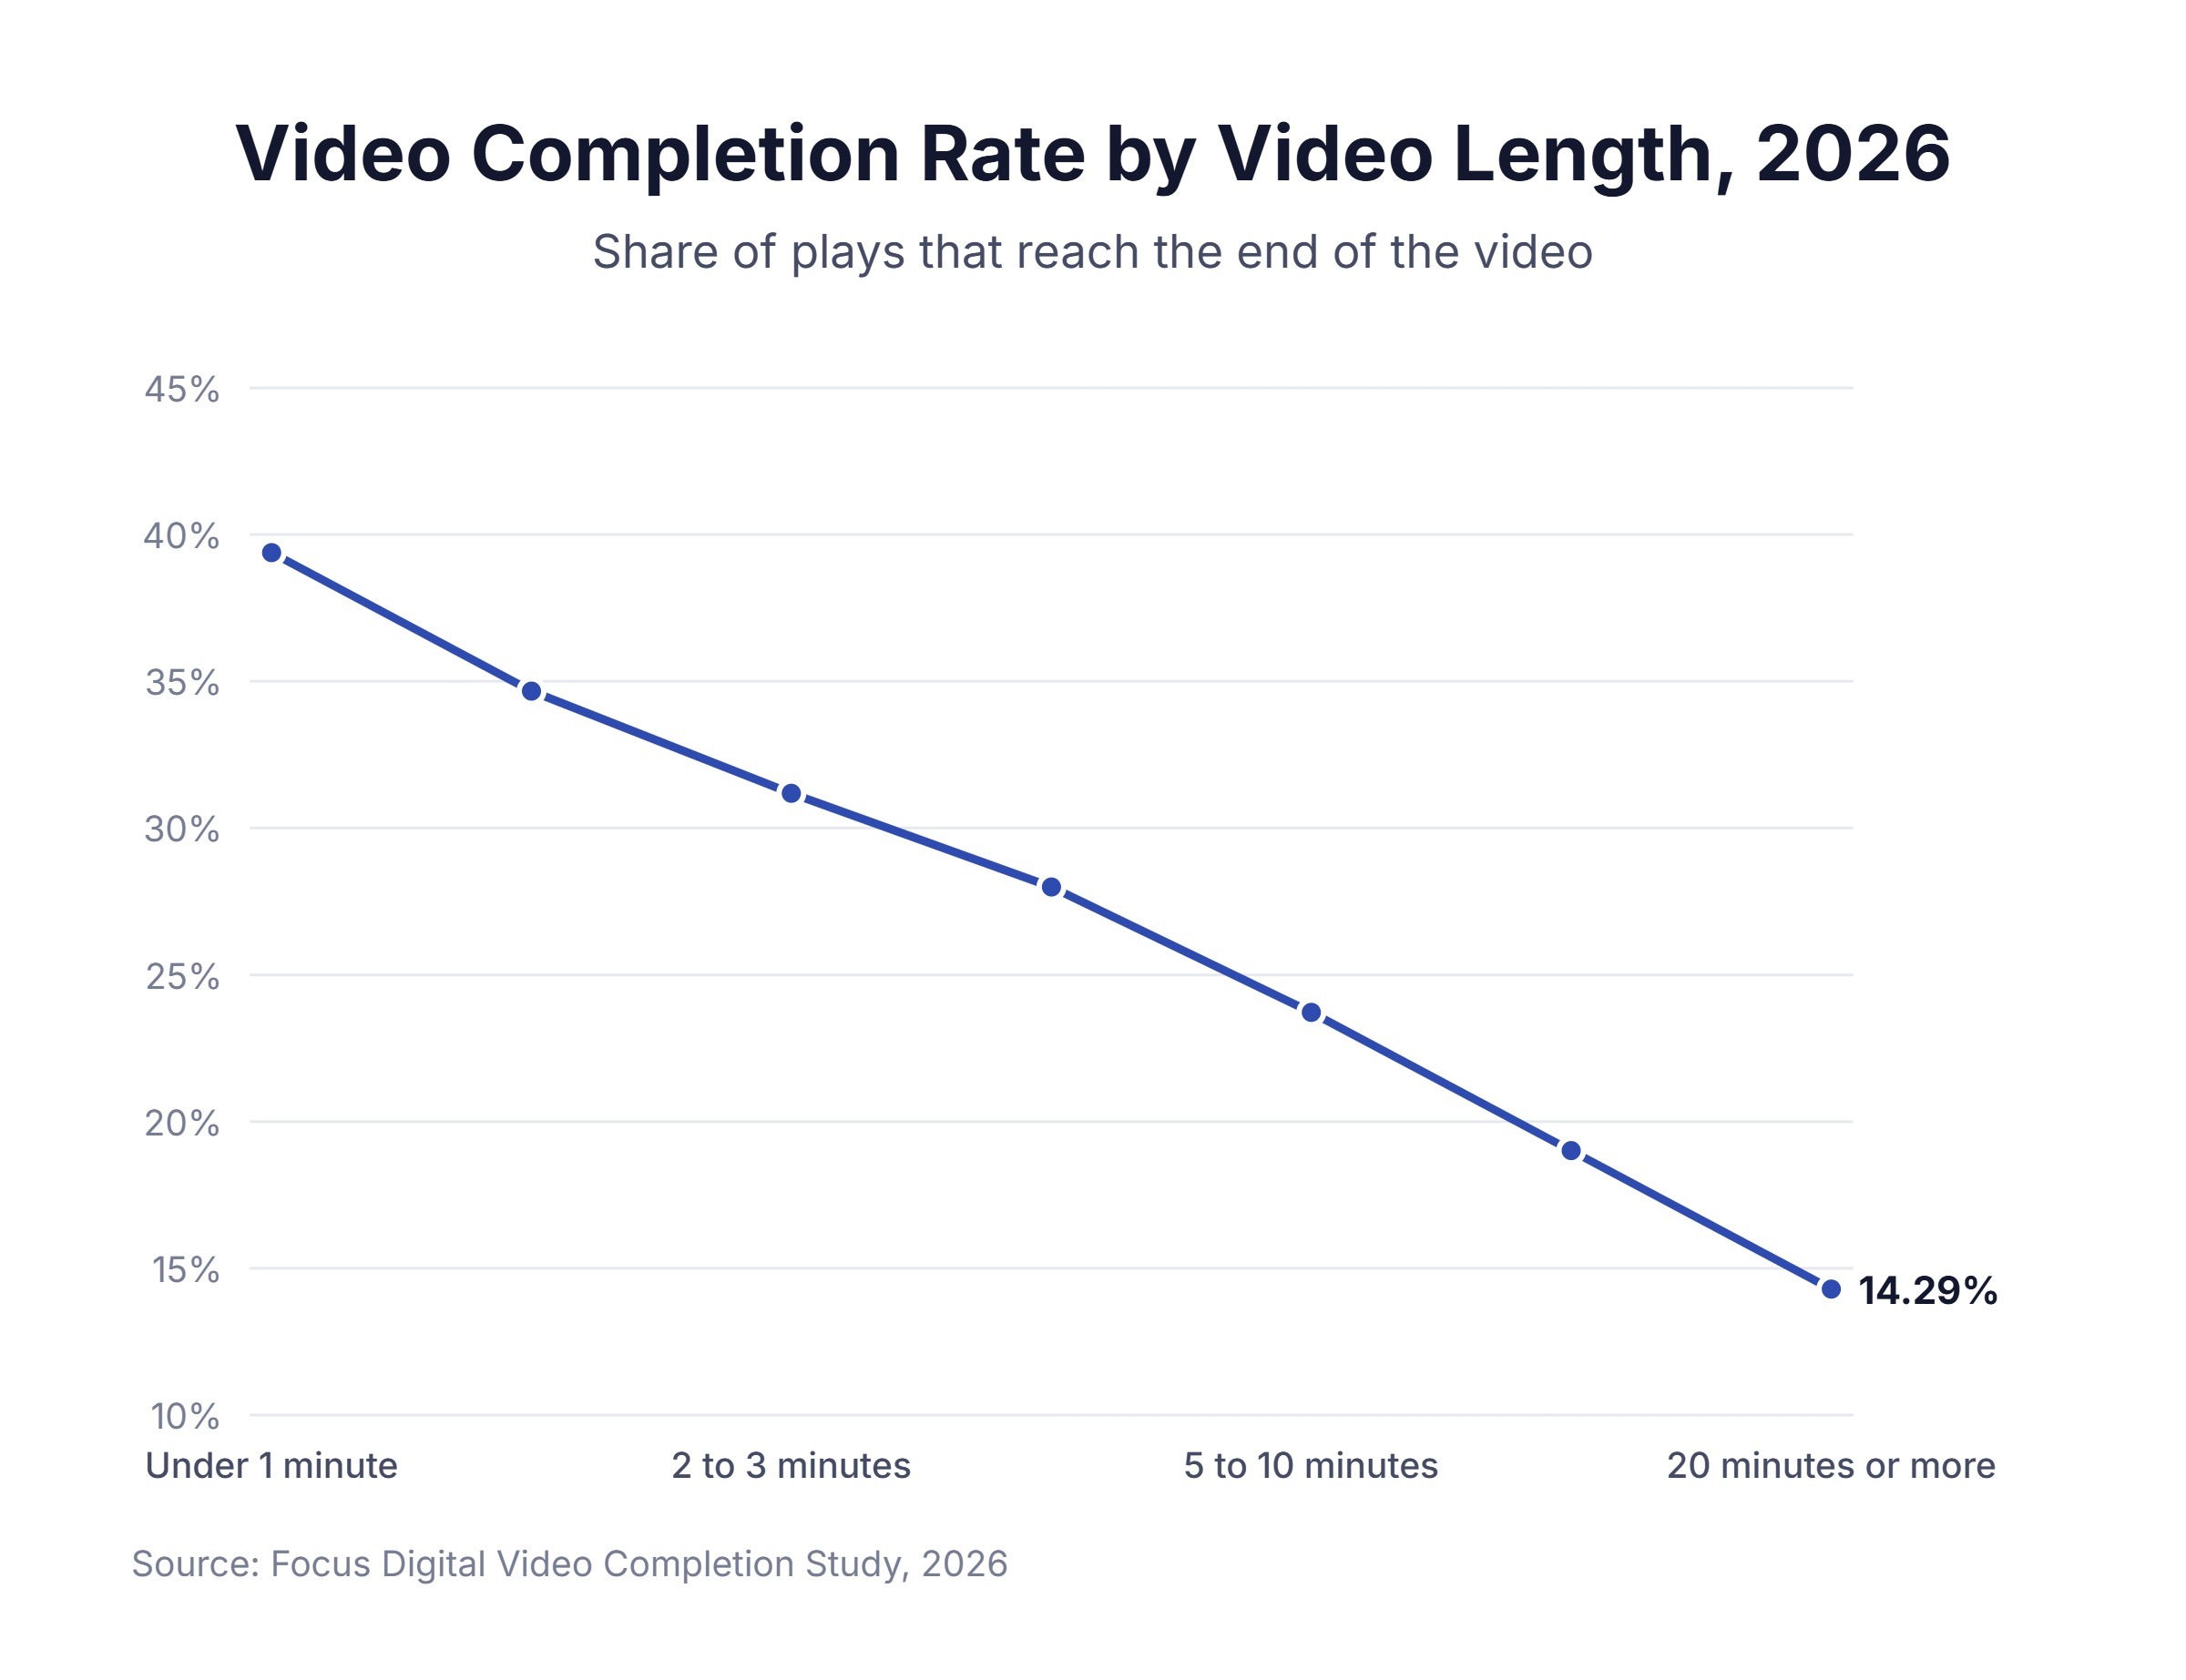
Completion falls steadily as videos get longer.
| Video length | Completion rate |
|---|---|
| Under 1 minute | 39.39% |
| 1 to 2 minutes | 34.67% |
| 2 to 3 minutes | 31.19% |
| 3 to 5 minutes | 27.99% |
| 5 to 10 minutes | 23.72% |
| 10 to 20 minutes | 19.01% |
| 20 minutes or more | 14.29% |
Key findings:
- Each doubling of length costs about 4.71 points. A two-minute video finishes at roughly the rate of a one-minute video minus 4.71 points, and the same drop repeats from two minutes to four.
- Long videos lose fewer viewers per minute. Past 10 minutes, each extra minute costs about 0.31 points of completion, compared with about 6.29 points per minute under two minutes. We think viewers who start a long video expect a long watch.
Video Completion Rate, 2025 vs. 2026
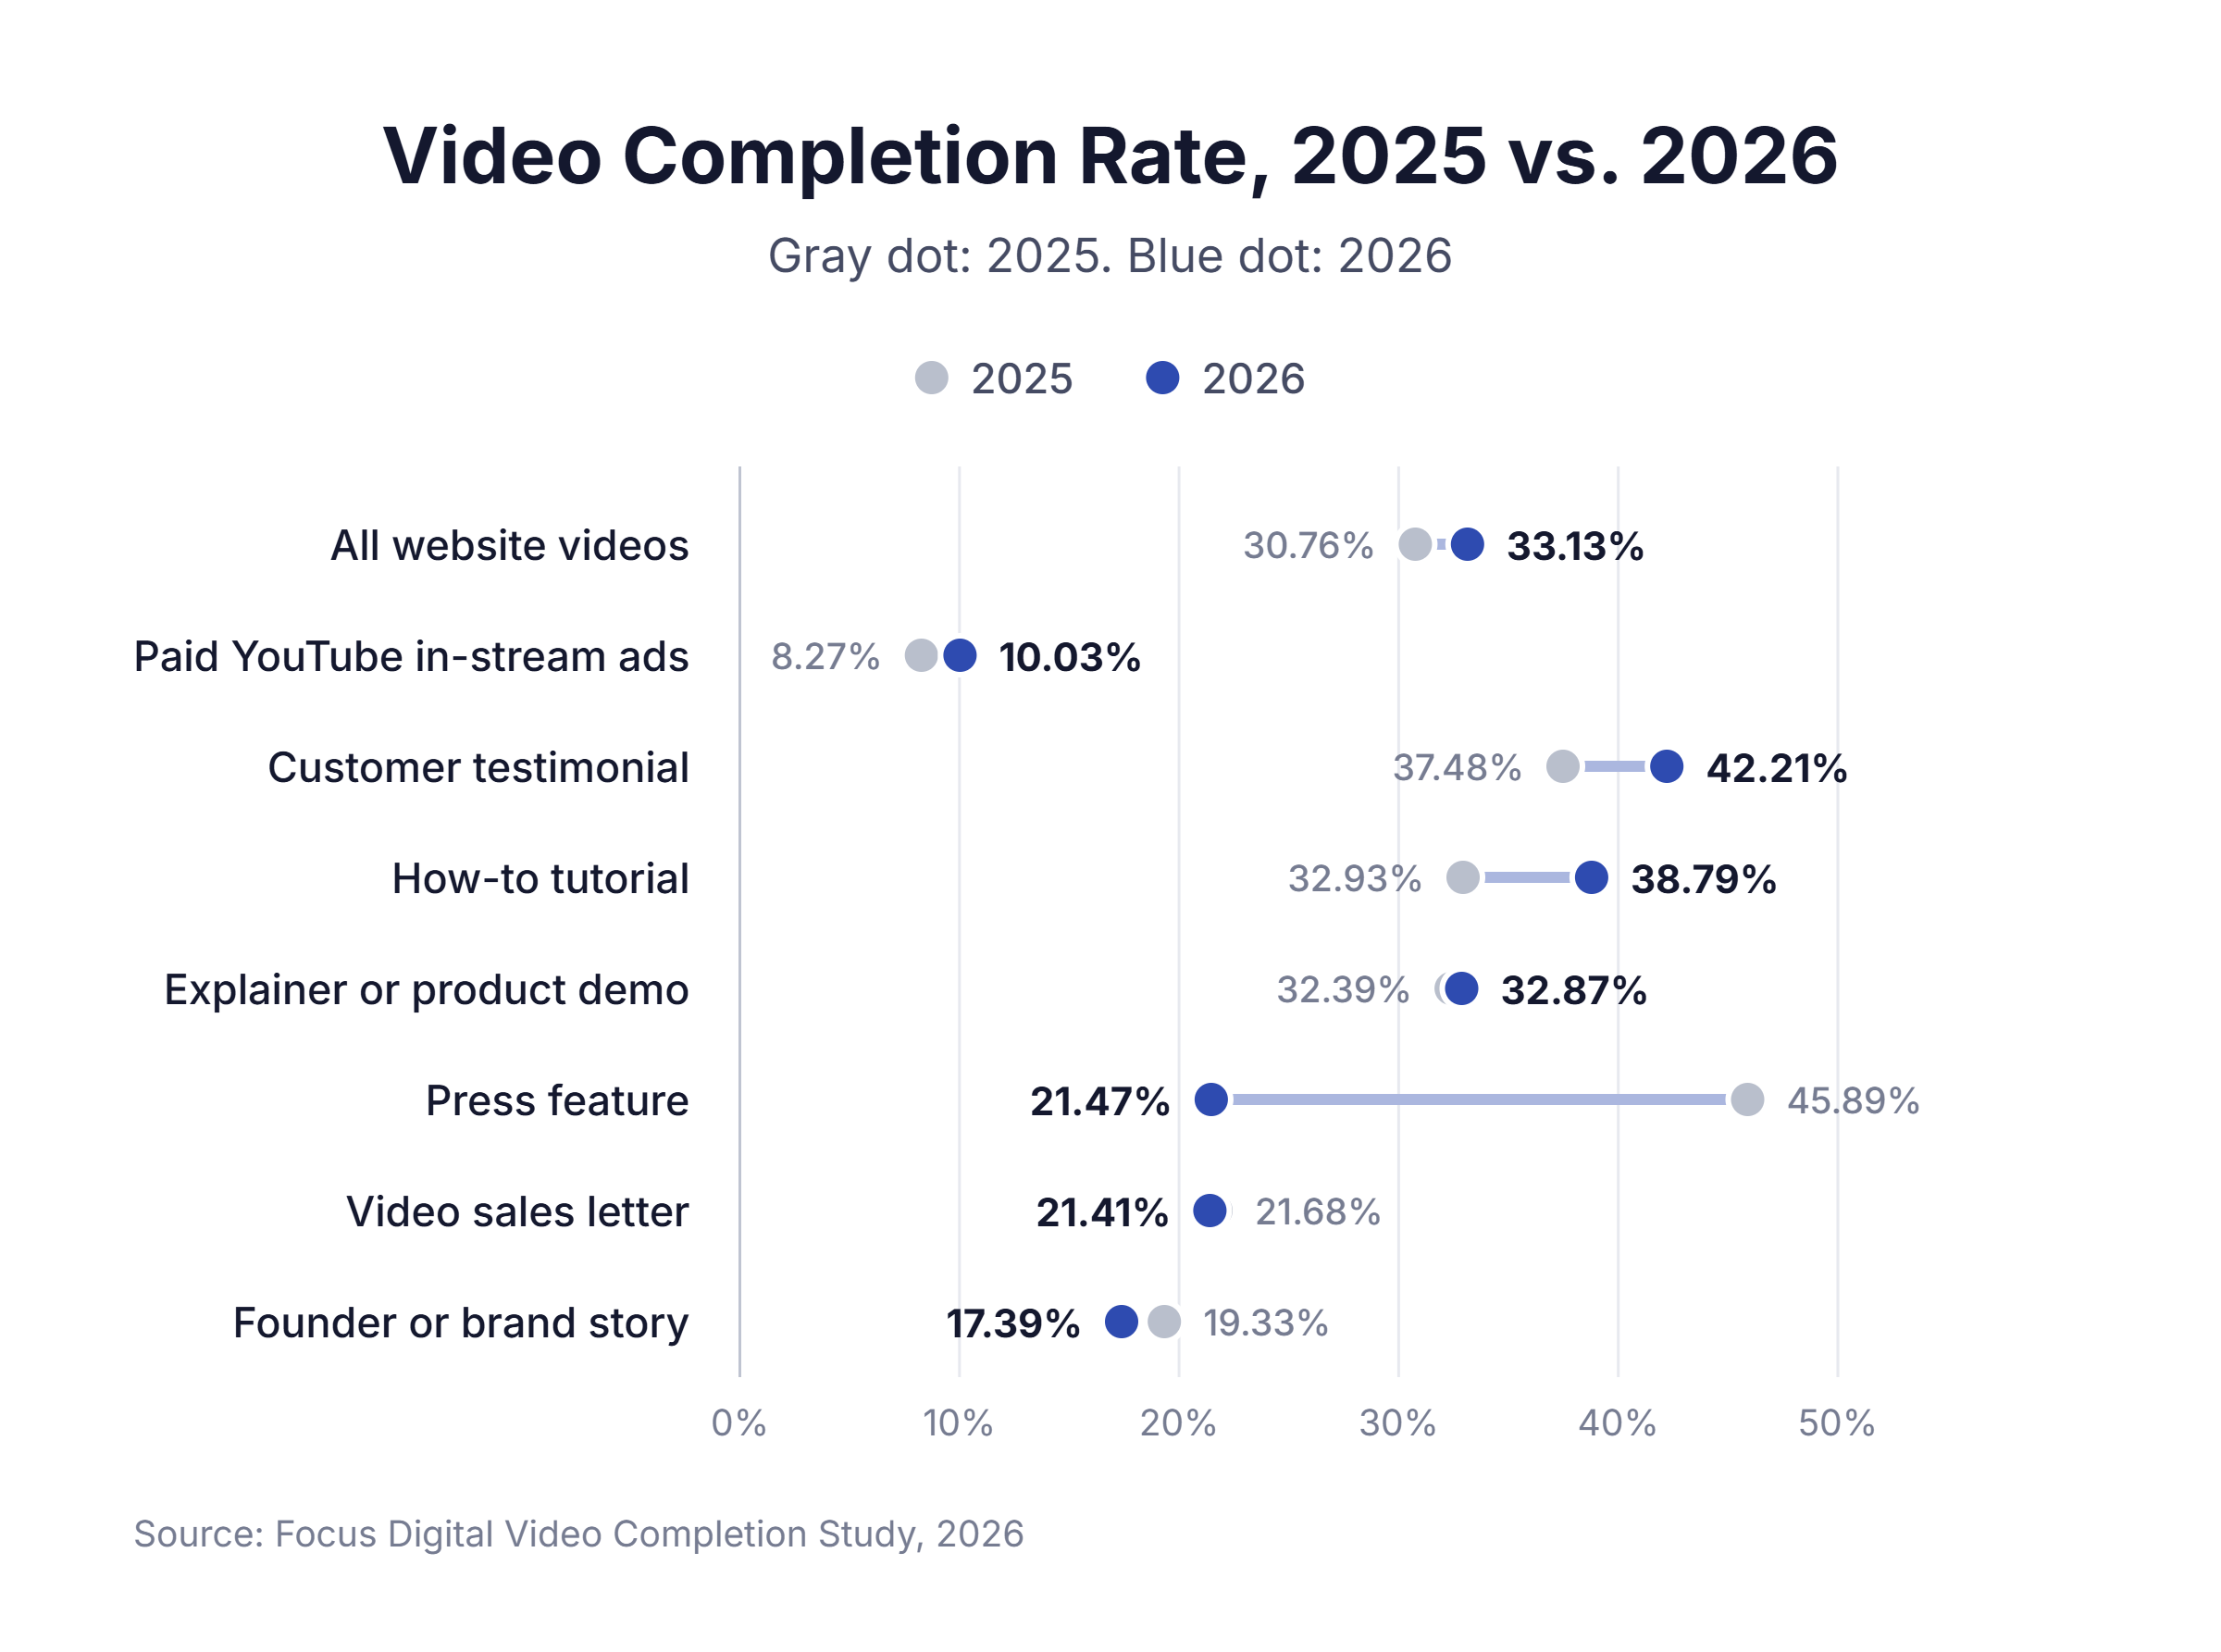
Website video completion rose 2.37 percentage points across our dataset.
| Video type | 2026 | 2025 | Change |
|---|---|---|---|
| All website videos | 33.13% | 30.76% | +2.37 points |
| Customer testimonial | 42.21% | 37.48% | +4.73 points |
| How-to tutorial | 38.79% | 32.93% | +5.86 points |
| Explainer or product demo | 32.87% | 32.39% | +0.48 points |
| Press feature | 21.47% | 45.89% | -24.42 points |
| Video sales letter | 21.41% | 21.68% | -0.27 points |
| Founder or brand story | 17.39% | 19.33% | -1.94 points |
| Paid YouTube in-stream ads | 10.03% | 8.27% | +1.76 points |
Key findings:
- Useful videos gained the most. How-to tutorials and testimonials rose 5.86 and 4.73 points. We believe more shoppers now look for proof and instructions before they buy.
- Press features fell hardest. Completion dropped 24.42 points. We think older news segments lost relevance as they aged on the sites that host them.
- VSL completion held flat. Video sales letters moved only 0.27 points, which suggests the format has hit a ceiling at its current length.
Video Completion Rate by Device and Traffic Source
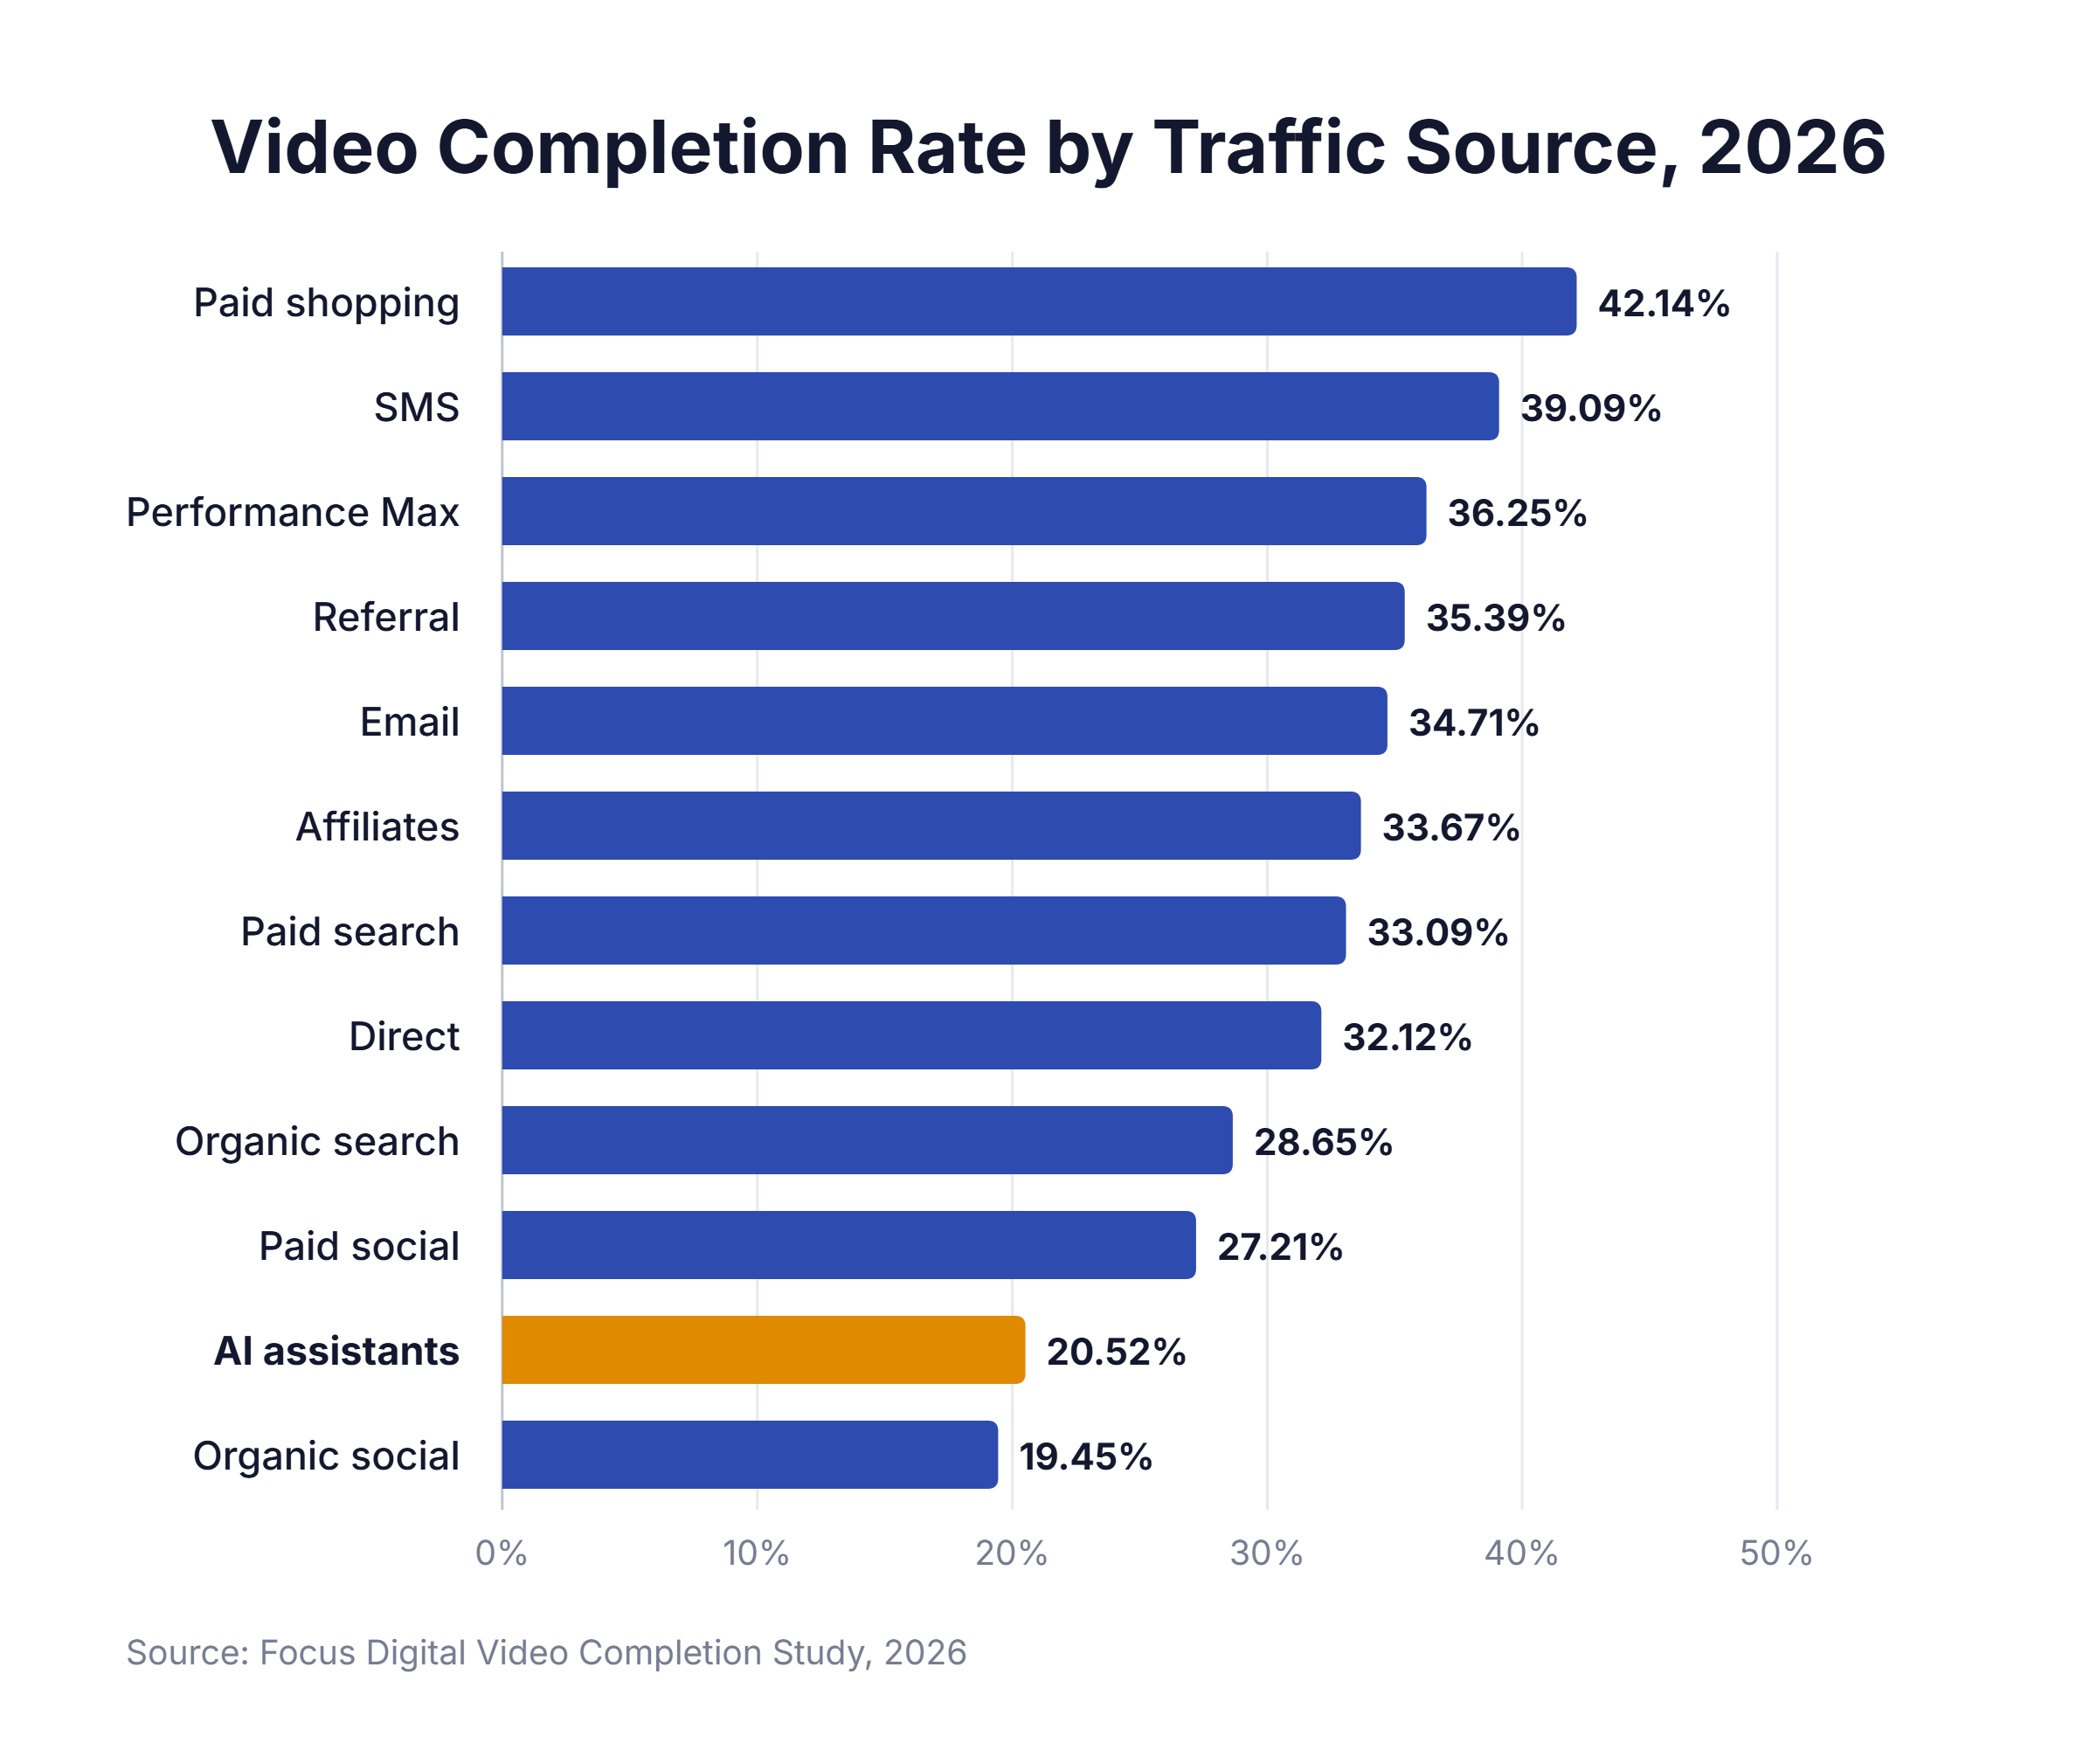
Mobile viewers press play most often and finish least often.
| Device | Completion rate | Share of plays |
|---|---|---|
| Tablet | 37.45% | 2.09% |
| Desktop | 37.19% | 17.13% |
| Mobile | 29.34% | 80.76% |
| Traffic source | Completion rate |
|---|---|
| Paid shopping (Google Shopping) | 42.14% |
| SMS | 39.09% |
| Performance Max | 36.25% |
| Referral | 35.39% |
| 34.71% | |
| Affiliates | 33.67% |
| Paid search | 33.09% |
| Direct | 32.12% |
| Organic search | 28.65% |
| Paid social | 27.21% |
| AI assistants | 20.52% |
| Organic social | 19.45% |
Key findings:
- Mobile drives the plays and the drop-off. Mobile accounts for 80.76% of website video plays, and those viewers finish 7.84 points less often than desktop viewers. Captions and vertical framing help most on phones, where sound is often off.
- Shoppers ready to buy watch to the end. Paid shopping and SMS visitors finish more than twice as often as organic social visitors. A shopper who clicked a product listing came to evaluate that product.
- AI assistant visitors skim. Visitors from ChatGPT and other assistants finish 20.52% of videos. We think these visitors arrive with an answer in hand and use the page to confirm it.
How Long Should a Video Sales Letter Be?
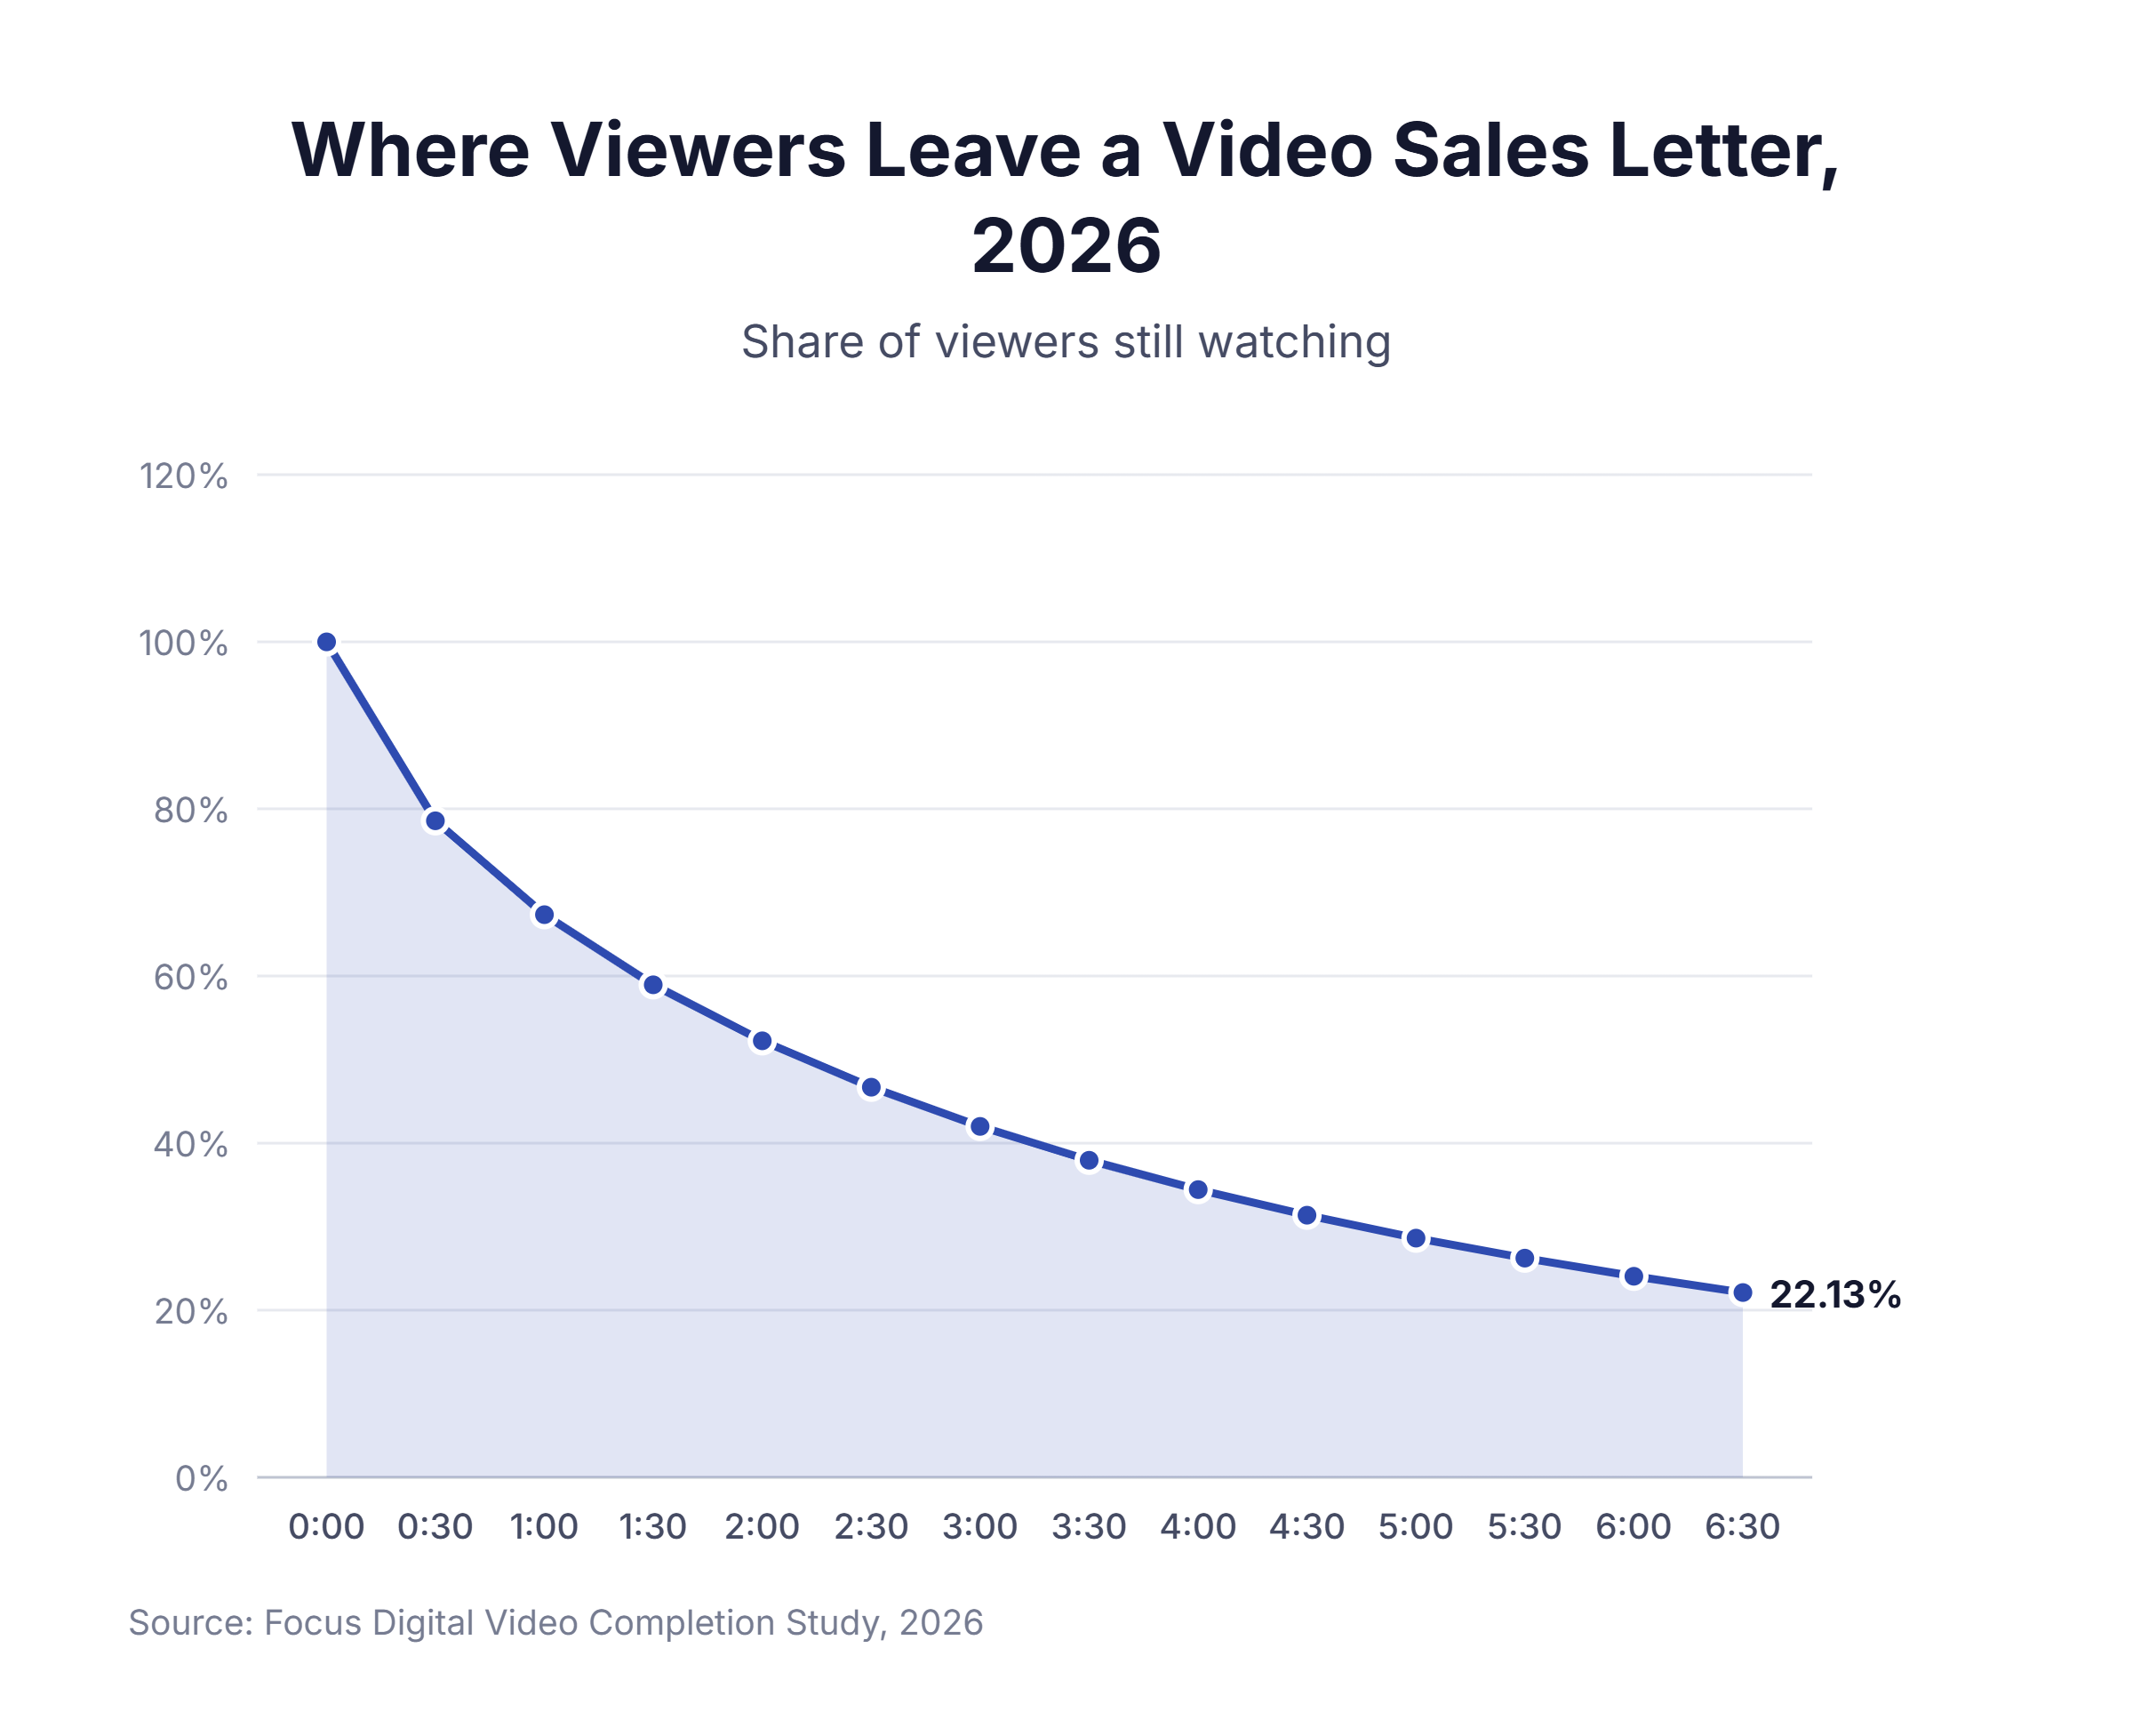
A video sales letter should deliver its offer within the first two minutes, because half of viewers leave by 2:11.
| Point in a 6:42 VSL | Share of viewers gone |
|---|---|
| 0:38 | 25% |
| 2:11 | 50% |
| 5:46 | 75% |
| End of video | 78.59% |
Key findings:
- The first 38 seconds decide a quarter of the audience. One in four VSL viewers leaves before the first minute ends.
- Shorter VSLs keep more buyers. A VSL under five minutes finishes at about 27.99%, compared with 23.72% for a five-to-ten-minute VSL.
- Put the offer and call to action before 2:11. Viewers who reach the halfway point of the audience curve have already heard the problem, so present the offer while half of them are still watching.
Why Viewers Stop Watching Website Videos
The first 10% of a video loses more viewers than any other stretch.
| Part of the video | Share of viewers who leave | Most likely reason | Fix |
|---|---|---|---|
| First 10% | 19.09% | The opening does not show why the video is worth watching | Open with the result or the question the video answers |
| 10% to 25% | 14.45% | The video repeats what the page already says | Cut the introduction and logo animation |
| 25% to 50% | 15.37% | The viewer got the main point | Move the strongest proof into the first half |
| 50% to 75% | 10.35% | The pace slows | Tighten the edit and remove repeated points |
| 75% to end | 7.57% | The viewer leaves for the next step | Put the call to action before the closing credits |
Key findings:
- The opening loses 19.09% of viewers. Almost one in five viewers decides within the first tenth of the video.
- Almost three quarters of drop-off happens in the first half. 48.91% of all viewers leave before the halfway point, compared with 17.92% in the second half.
How to Raise Your Video Completion Rate
Each change below raises completion by the amount shown, measured from our 33.13% website average.
| Do this | What it fixes | Raises completion by up to |
|---|---|---|
| Swap a brand story for a customer testimonial | A slow, logo-heavy opening | 24.82 percentage points |
| Break a webinar replay into short clips | An hour-long video few viewers finish | 19.16 percentage points |
| Cut a three-to-five-minute video under two minutes | Viewers leave before the point | 6.68 percentage points |
| Promote the video to email and SMS subscribers | Cold viewers who were not looking for it | 5.96 percentage points |
| Open with the result in the first 10% | Early drop-off | 3.91 percentage points |
| Add captions and vertical framing for mobile | Mobile viewers watching with sound off | 3.92 percentage points |
The changes overlap, so their effects do not add together. A business that leads with a short testimonial and sends it to warm subscribers stacks the two largest gains.
What a Good Video Completion Rate Looks Like
Use these benchmarks, drawn from the 77 website videos in our study with 100 or more plays, to grade your own videos.
- Strong: above 46.87%, the top quarter of website videos.
- Typical: about 34.01%, the median website video.
- Needs work: below 18.55%, the bottom quarter of website videos.
- Video sales letters: above 21.41% is better than average for a VSL.
- Paid YouTube in-stream ads: above 10.03% of impressions reaching the end is better than average.
How These Figures Are Calculated
- Completion rate = video completes ÷ video starts × 100
- Average share watched = the area under the retention curve, the average share of the video each viewer watches
- Half the audience gone by = the point where the retention curve crosses 50%, multiplied by the typical video length
Each brand counts equally in website averages, so one high-traffic site does not set the result. Paid ad rates count every impression as a start, because ad videos play on their own.
Further Reading
Requesting a Copy of This Report
If you’d like to request a PDF copy of this report or learn more about our agency, you can reach out here.
About the Data
This study covers 216,502 website video plays across 22 brands and 77 videos with 100 or more plays from November 2025 through October 2026, compared against 370,912 plays from November 2024 through October 2025, plus 95,751 Google Ads video impressions.
Sources
(5)
- Focus Digital Video Completion Rate Study, 2026. Built from our clients’ Google Analytics 4 website video events (start, 10%, 25%, 50%, and 75% progress, and complete) and Google Ads video quartile data, combined with a compilation of published platform and webinar benchmarks and Focus Digital retention modeling. Each website video is classified by type and style from its title and page.
- Dash Social, 2025 YouTube Benchmark Report
- ON24, Key Takeaways From the 2025 Webinar Benchmarks Report (51-minute average webinar engagement)
- Vaizle, Hook Rate and Hold Rate for Facebook Video Ads
- Shortimize, Watch Time on TikTok, Reels, and Shorts