Our team recently completed a meta-analysis of companies across the fintech industry to determine the average customer acquisition cost (CAC) for fintech companies. This article will aid marketing and finance teams within fintech to determine a baseline for their customer acquisition cost compared to other companies in their industry.
The average CAC for Fintech is Broken Down by:
- Niches within fintech
- Traffic source used to acquire the customer
- Target market of fintech software
- Price point of fintech software
Calculating Customer Acquisition Cost
In calculating the customer acquisition cost for fintech companies, the following formula is used.
Customer Acquisition Cost (CAC) = Total Amount Spent on Marketing / Number of New Customer Acquired
Note: As prices of the Fintech software increase, the chances the company relies on advertising methods that are traditionally more direct to consumers such as Meta Ads decreases, but we have included the metrics for the sake of completeness.
Average CAC By Niche and Traffic Source
The following table breaks down the average CAC for fintech companies by niche and traffic source.
Fintech Niches Example Email CAC LinkedIn CAC Organic Social Media CAC Meta Ads CAC Google Ads CAC SEO CAC Average CAC
Payment PayPal $3.35 $5.87 $5.03 $7.55 $6.71 $4.19 $5.45
Banking Chime $116.48 $203.84 $174.72 $262.08 $232.96 $145.60 $189.28
Investment Robinhood $25.92 $45.36 $38.88 $58.32 $51.84 $32.40 $42.12
Lending Affirm $26.82 $46.93 $40.23 $60.34 $53.64 $33.52 $43.58
Financial Management Rocket Money $14.40 $25.20 $21.60 $32.40 $28.80 $18.00 $23.40
Blockchain & Cryptocurrency Coinbase $11.20 $19.60 $16.80 $25.20 $22.40 $14.00 $18.20
Regtech Persona $2,880.00 $5,040.00 $4,320.00 $6,480.00 $5,760.00 $3,600.00 $4,680.00
SMB Quickbooks $518.40 $907.20 $777.60 $1,166.40 $1,036.80 $648.00 $842.40
Enterprise Bloomberg Terminal $16,200.00 $28,350.00 $24,300.00 $36,450.00 $32,400.00 $20,250.00 $26,325.00
Generally, a target CAC can be found by examining the LTV of the product. If the lifetime value of a customer is $10,000, we would recommend a company spend a maximum of $2,500 acquiring that customer to maintain a LTV:CAC ratio of 4:1.
For companies with high LTVs in the millions of dollars, an LTV:CAC ratio of 4:1 is unrealistic. Rather, they should aim for a first-year revenue:CAC ratio of 3:1 or 4:1.
Average CAC By Target Market and Traffic Source
Similarly, this table shows the average CAC by the target market of the fintech product broken down by who the target market is.
Target Market Example Email CAC LinkedIn CAC Organic Social Media CAC Meta Ads CAC Google Ads CAC SEO CAC Average CAC
Individual Consumers Robinhood $25.92 $45.36 $38.88 $58.32 $51.84 $32.40 $42.12
Small and Medium-Sized Enterprises (SMEs) Square $881.28 $1,542.24 $1,321.92 $1,982.88 $1,762.56 $1,101.60 $1,432.08
Large Corporations SAP $20,936.40 $36,638.70 $31,404.60 $47,106.90 $41,872.80 $26,170.50 $34,021.65
Banks and Financial Institutions Finastra $16,386.32 $28,676.06 $24,579.48 $36,869.22 $32,772.64 $20,482.90 $26,627.77
Investment Firms and Hedge Funds Bloomberg Terminal $16,200.00 $28,350.00 $24,300.00 $36,450.00 $32,400.00 $20,250.00 $26,325.00
Insurance Companies Guidewire Software $41,536.72 $72,689.26 $62,305.08 $93,457.62 $83,073.44 $51,920.90 $67,497.17
Government and Public Sector Palantir Technologies $174,792.08 $305,886.14 $262,188.12 $393,282.18 $349,584.16 $218,490.10 $284,037.13
Nonprofits and NGOs Blackbaud $2,400.00 $4,200.00 $3,600.00 $5,400.00 $4,800.00 $3,000.00 $3,900.00
Average CAC By Price Point and Traffic Source
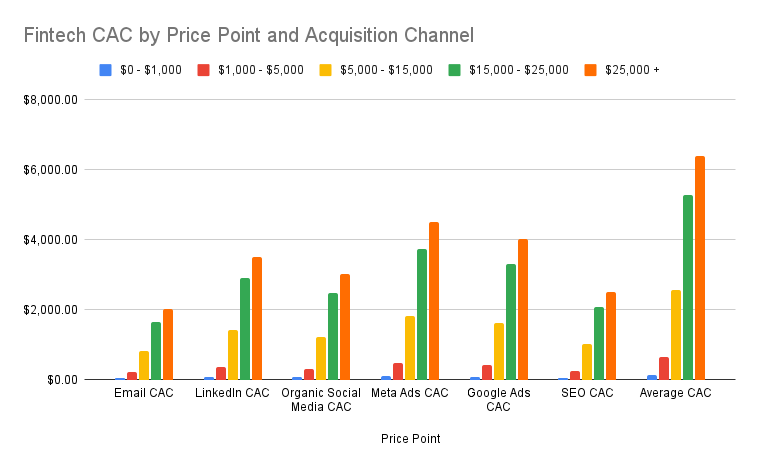
Lastly, we’ve broken down the average CAC for fintech products by the price point of the product.
Yearly Price Point Example Email CAC LinkedIn CAC Organic Social Media CAC Meta Ads CAC Google Ads CAC SEO CAC Average CAC
$0 - $1,000 PayEase $40.88 $71.54 $61.32 $91.98 $81.76 $51.10 $129.94
$1,000 - $5,000 LendSmart $206.08 $360.64 $309.12 $463.68 $412.16 $257.60 $655.04
$5,000 - $15,000 InvestWave $806.96 $1,412.18 $1,210.44 $1,815.66 $1,613.92 $1,008.70 $2,564.98
$15,000 - $25,000 FinGuard $1,658.48 $2,902.34 $2,487.72 $3,731.58 $3,316.96 $2,073.10 $5,271.60
$25,000 + QuantCapital $2,006.48 $3,511.34 $3,009.72 $4,514.58 $4,012.96 $2,508.10 $6,377.74
If you would like a copy of this report, please contact us on the Contact Us page.
Sources:
Pulse on LinkedIn
