Last updated: October 2026
The median email campaign loses 0.22% of its recipients to unsubscribes, or one opt-out for every 455 delivered emails. By industry, the median ranges from 0.09% for legal firms to 0.40% for photo and video businesses. By send frequency, it ranges from 0.33% for senders who mail twice a week to 0.87% for senders who mail less than once a month.
We studied unsubscribe rates by industry, send frequency, email type, region, and year. We also estimated two figures the platform benchmarks don’t report: how much of a list each sending cadence loses in a year, and how many subscribers each industry loses for every 100 clicks it earns.
Key takeaways:
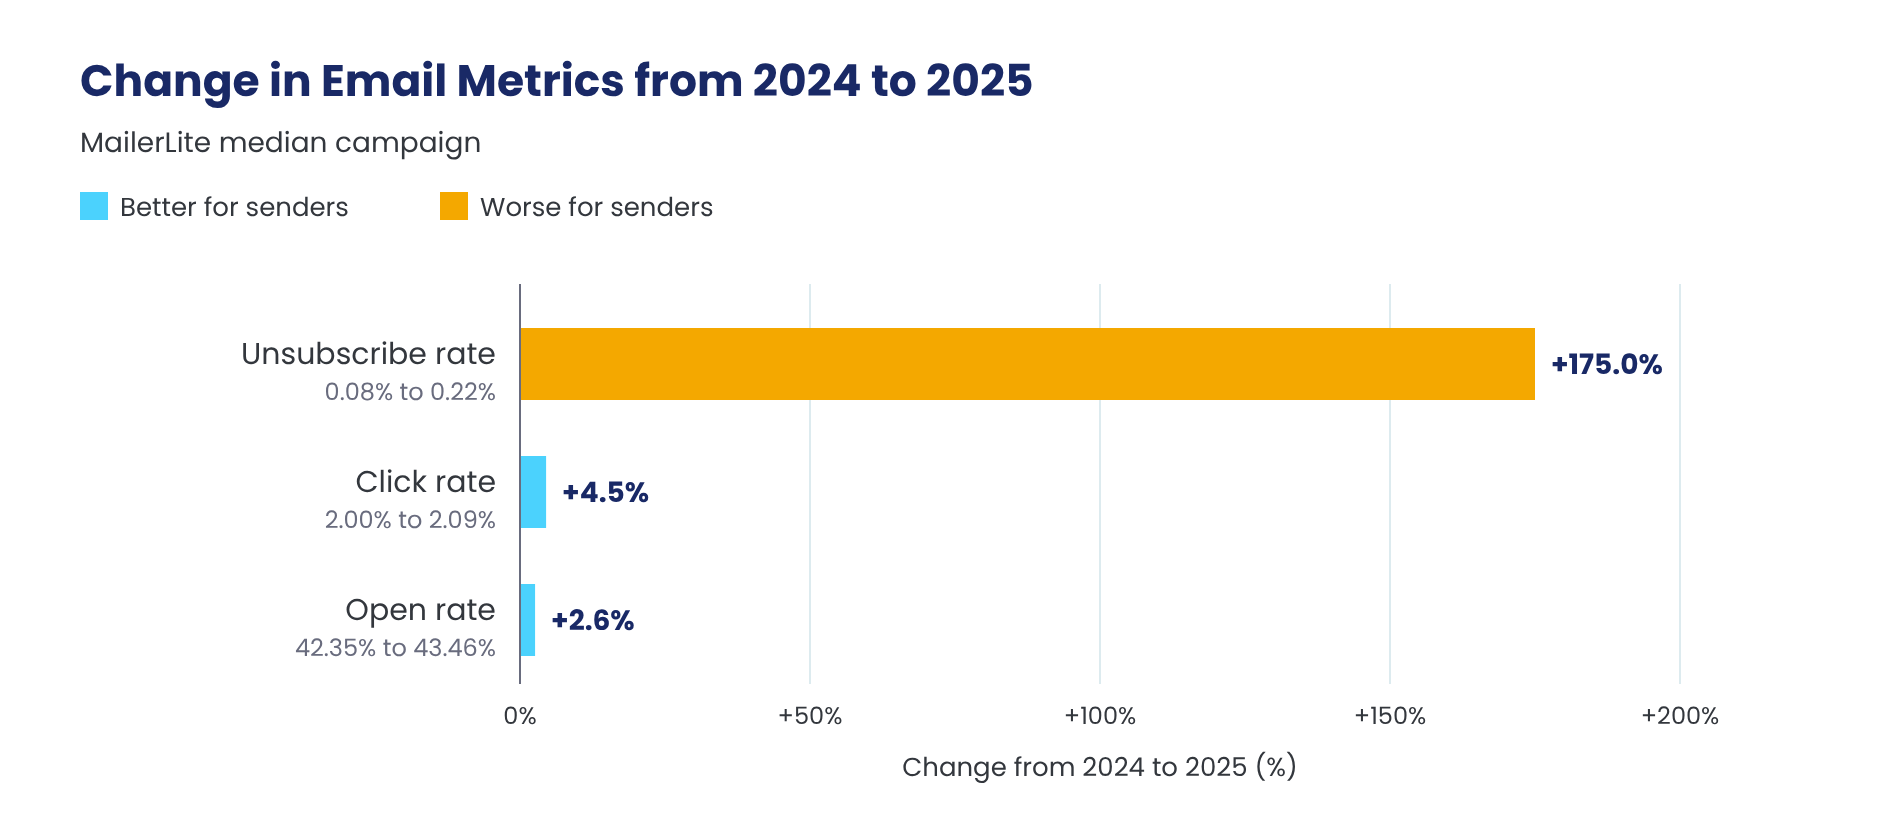
- The median unsubscribe rate rose from 0.08% in MailerLite’s prior-year benchmark to 0.22% in 2025, a 2.75x increase after Gmail required one-click unsubscribe in June 2024.
- Twice-weekly senders lose 0.33% of recipients per send, the lowest rate of any cadence. Senders who mail less than once a month lose 2.6x as much, at 0.87%.
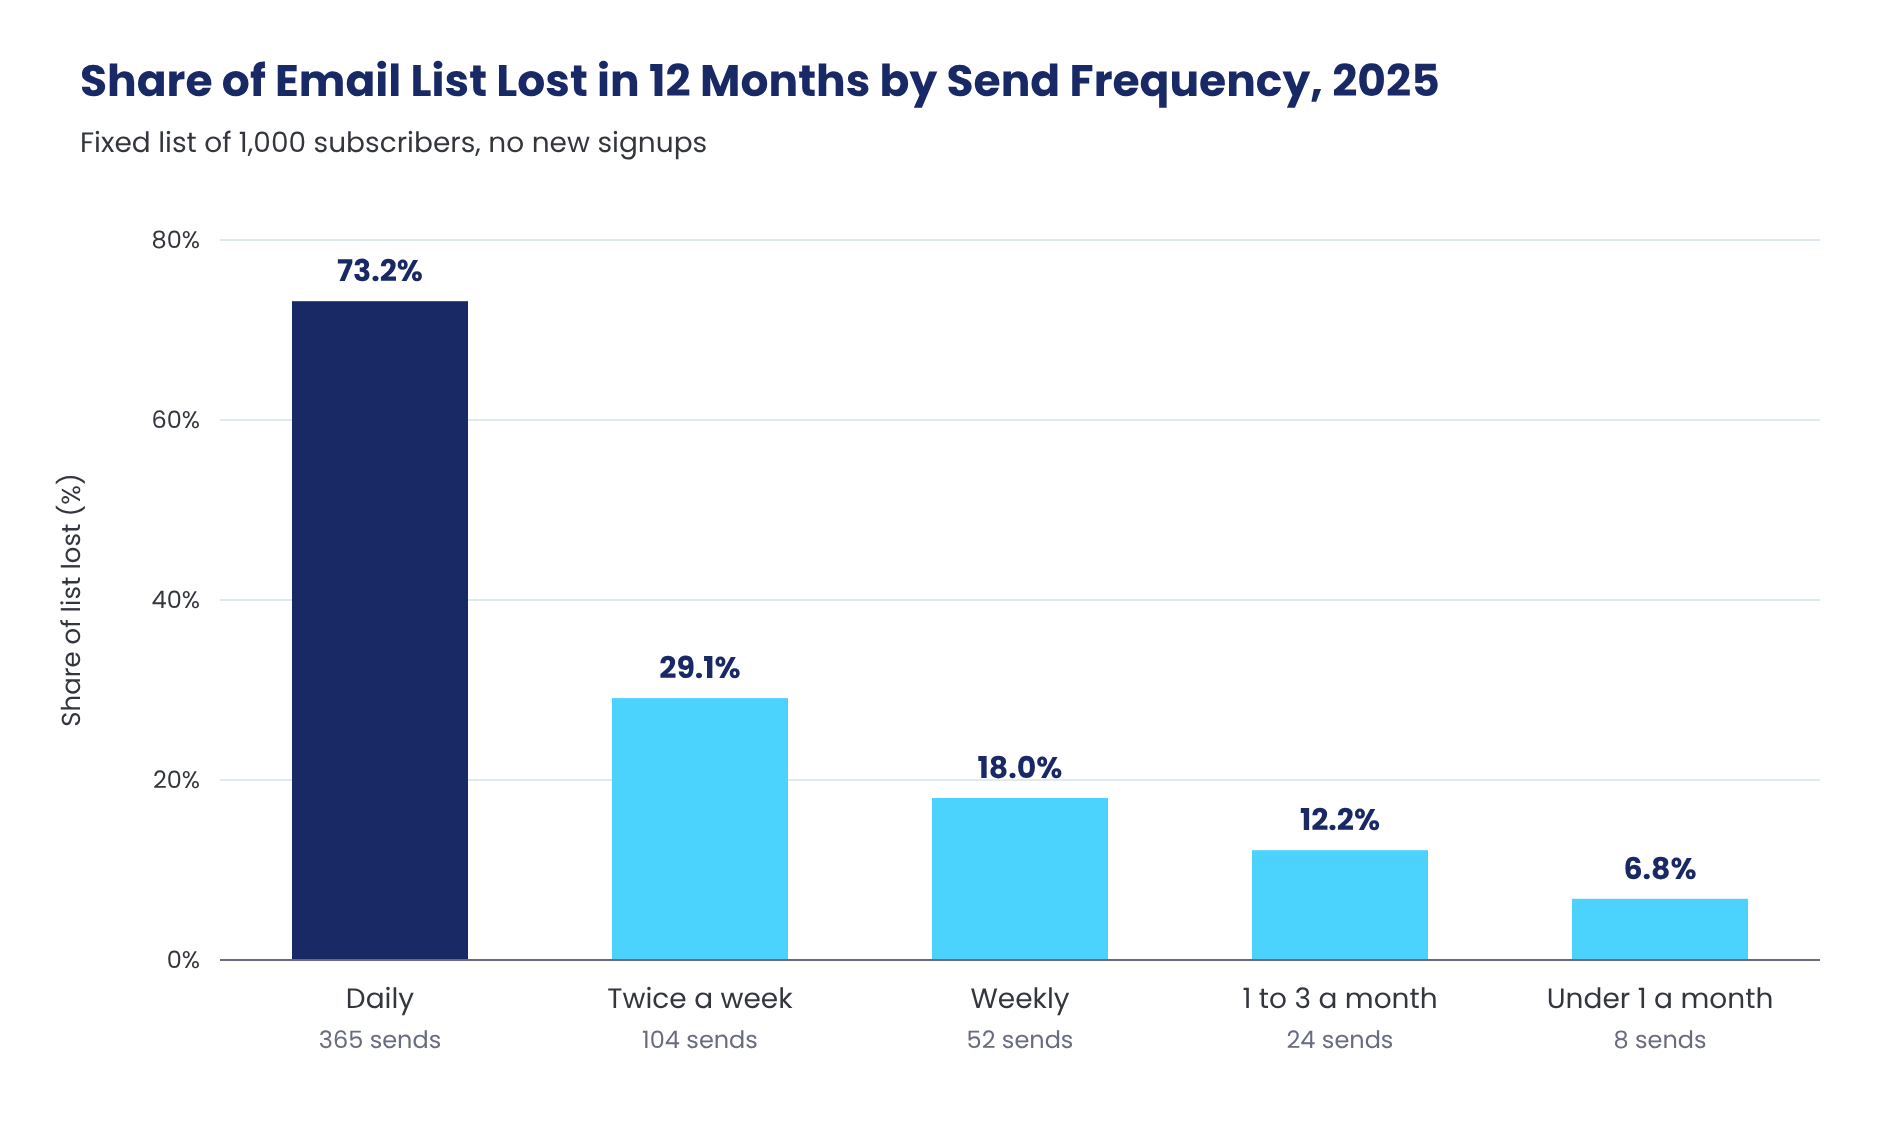
- A weekly sender loses 18.0% of a fixed list in 12 months. A twice-weekly sender loses 29.1%, and a daily sender loses 73.2%.
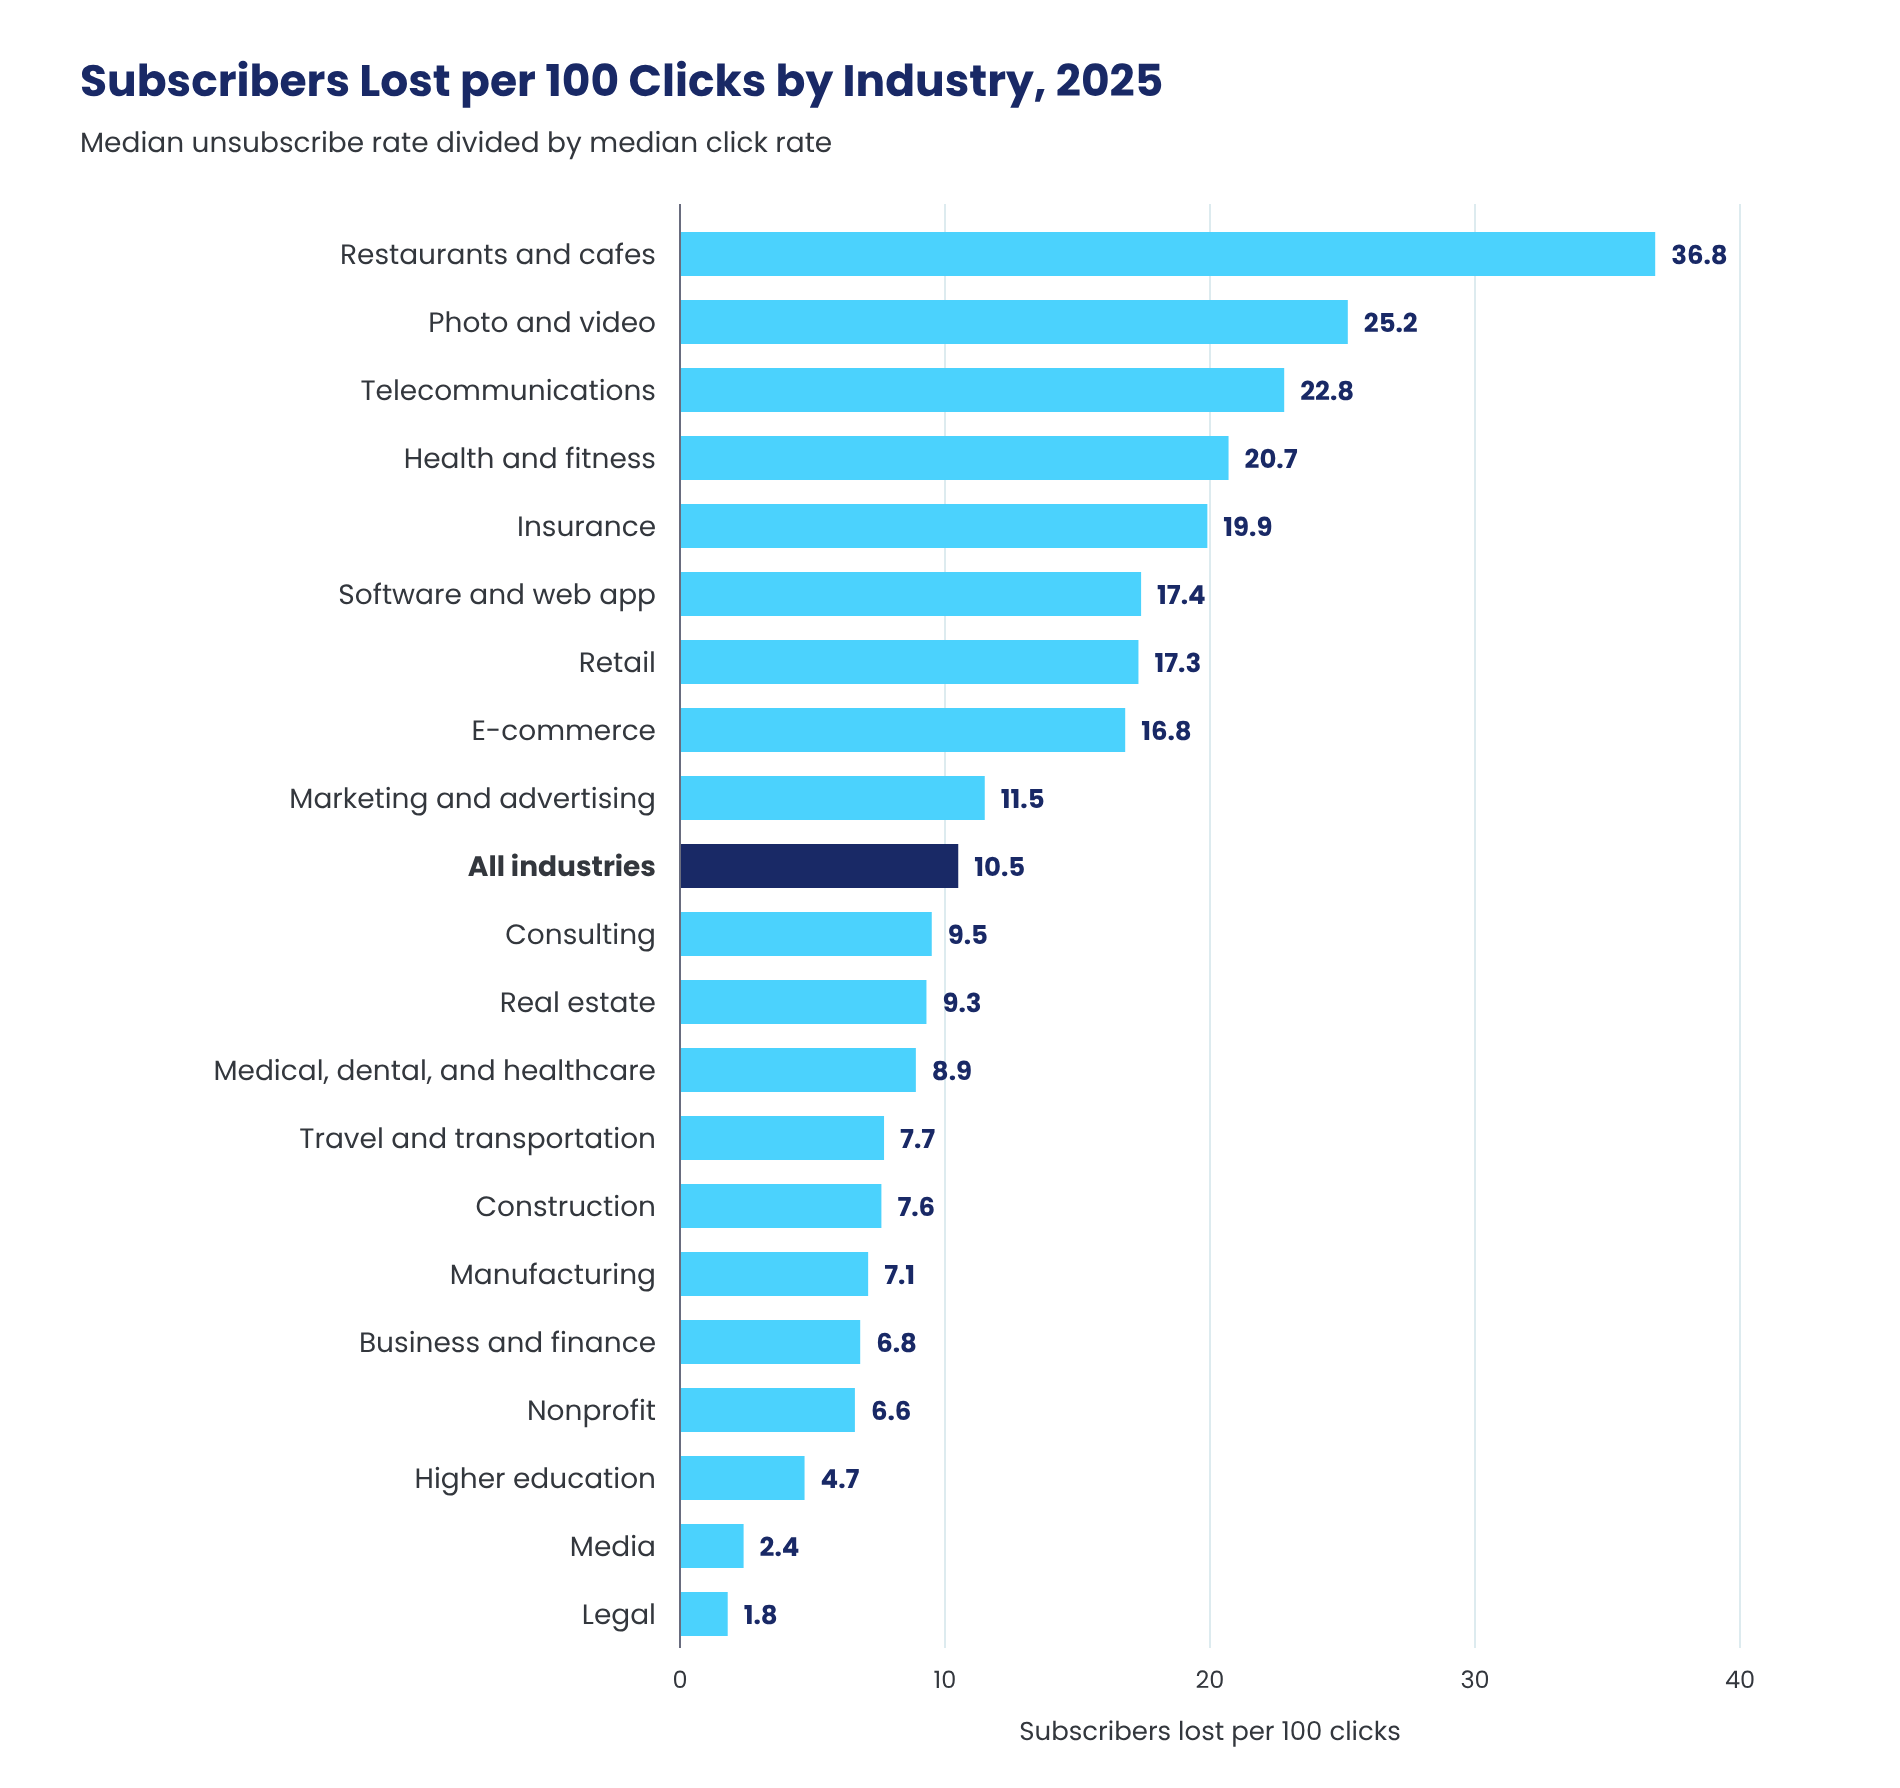
- Restaurants and cafes lose 36.8 subscribers for every 100 clicks, 20x the 1.8 that legal firms lose.
- Welcome emails lose 0.87% of recipients, 4.35x the 0.20% rate of standard campaigns.
- Brevo’s average unsubscribe rate of 0.46% runs 2.09x MailerLite’s median of 0.22%, so the benchmark a sender picks can double or halve the target.
Average Email Unsubscribe Rate by Industry
Each row shows the median unsubscribe rate per campaign in 2025. The last column divides unsubscribes by clicks to show how many subscribers a sender loses for every 100 clicks the emails earn.
| Industry | Unsubscribe rate | Click rate | Subscribers lost per 100 clicks |
|---|---|---|---|
| Legal | 0.09% | 4.90% | 1.8 |
| Media | 0.10% | 4.10% | 2.4 |
| Higher education | 0.10% | 2.15% | 4.7 |
| Travel and transportation | 0.13% | 1.68% | 7.7 |
| Marketing and advertising | 0.15% | 1.30% | 11.5 |
| Business and finance | 0.16% | 2.37% | 6.8 |
| Real estate | 0.16% | 1.72% | 9.3 |
| E-commerce | 0.18% | 1.07% | 16.8 |
| Nonprofit | 0.19% | 2.90% | 6.6 |
| Medical, dental, and healthcare | 0.20% | 2.25% | 8.9 |
| Software and web app | 0.20% | 1.15% | 17.4 |
| Retail | 0.22% | 1.27% | 17.3 |
| Consulting | 0.23% | 2.41% | 9.5 |
| Insurance | 0.27% | 1.36% | 19.9 |
| Construction | 0.27% | 3.53% | 7.6 |
| Manufacturing | 0.30% | 4.22% | 7.1 |
| Health and fitness | 0.30% | 1.45% | 20.7 |
| Telecommunications | 0.34% | 1.49% | 22.8 |
| Restaurants and cafes | 0.39% | 1.06% | 36.8 |
| Photo and video | 0.40% | 1.59% | 25.2 |
| All industries | 0.22% | 2.09% | 10.5 |
Key findings:
- Restaurants and cafes post the second-highest unsubscribe rate and one of the lowest click rates, so they lose 36.8 subscribers per 100 clicks.
- Manufacturing and health and fitness share a 0.30% unsubscribe rate. Manufacturing earns 2.9x the clicks, so it loses 7.1 subscribers per 100 clicks, compared with 20.7 for health and fitness.
- E-commerce, retail, and software all sit at or below the 0.22% median, yet each loses 16.8 or more subscribers per 100 clicks because their click rates are low.
We think the per-click figure is the better test of a list’s health. A low unsubscribe rate can hide a list that has stopped reading. A rate near the median paired with a high click rate shows subscribers who stay because the emails earn the click.
Why Unsubscribe Benchmarks Disagree
MailerLite reports the median campaign. Brevo reports an unweighted average, and its customer base differs from MailerLite’s. The table compares the two for the industries both platforms cover.
| Industry | MailerLite median | Brevo average | Brevo ÷ MailerLite |
|---|---|---|---|
| Real estate | 0.16% | 0.52% | 3.25x |
| Media | 0.10% | 0.31% | 3.10x |
| E-commerce | 0.18% | 0.46% | 2.56x |
| Software | 0.20% | 0.44% | 2.20x |
| Retail | 0.22% | 0.48% | 2.18x |
| Manufacturing | 0.30% | 0.48% | 1.60x |
| Restaurants and hospitality | 0.39% | 0.62% | 1.59x |
| Nonprofit | 0.19% | 0.30% | 1.58x |
| Insurance | 0.27% | 0.35% | 1.30x |
| Telecommunications | 0.34% | 0.35% | 1.03x |
| Government | 0.22% | 0.20% | 0.91x |
| All industries | 0.22% | 0.46% | 2.09x |
Key findings:
- Brevo’s average runs above MailerLite’s median in 10 of 11 industries, by as much as 3.25x in real estate.
- Brevo’s top 10% of senders lose 0.05% of recipients per send, while its average sender loses 0.46%, a 9.2x spread inside one platform.
- Government is the one industry where Brevo’s average falls below MailerLite’s median, at 0.20% versus 0.22%.
Two things push the Brevo figures higher, and the data can’t separate them. A few high-loss senders raise any average above the median. The two platforms also serve different customers. The government row shows the platform effect: a skewed average alone would not fall below the median.
Our read on this: a sender should benchmark against the median, because it describes the typical campaign. The average shows how far the worst senders in an industry pull the numbers up.
Unsubscribe Rate by Send Frequency
MailerLite sorted more than 42,000 accounts into five groups by the average number of days between campaign sends in 2025, then measured more than 12 billion emails. The rates in this section are averages, and they cover campaigns only, not automated emails.
| Send frequency | Days between sends | Unsubscribe rate | Click rate | Subscribers lost per 100 clicks |
|---|---|---|---|---|
| Daily | Under 1.5 | 0.36% | 4.97% | 7.2 |
| Twice a week | 1.5 to 3 | 0.33% | 5.31% | 6.2 |
| Weekly | 3 to 8 | 0.38% | 4.87% | 7.8 |
| 1 to 3 times a month | 8 to 31 | 0.54% | 4.32% | 12.5 |
| Less than once a month | Over 31 | 0.87% | 3.74% | 23.3 |
Key findings:
- Twice-weekly senders post the lowest unsubscribe rate and the highest click rate of any group.
- Senders who mail less than once a month lose 23.3 subscribers per 100 clicks, 3.8x the twice-weekly rate.
- The unsubscribe rate climbs 0.49 points from weekly to less than monthly, and changes by only 0.05 points across the three most frequent groups.
We think infrequent senders lose more subscribers per send because recipients no longer recognize them. A subscriber who hears from a brand every six weeks often reads the next email as a reminder to clean the inbox.
Annual List Loss by Send Frequency
A per-send rate understates what a frequent sender loses over a year. We applied each group’s per-send rate to a fixed list of 1,000 subscribers for a full year of sends, with no new signups.
The model gives an upper estimate. Subscribers who stay through many sends tend to be the engaged ones, so a real list’s rate usually falls as the year goes on.
| Send frequency | Sends per year | Unsubscribe rate per send | Share of list lost in 12 months | Subscribers left of 1,000 |
|---|---|---|---|---|
| Daily | 365 | 0.36% | 73.2% | 268 |
| Twice a week | 104 | 0.33% | 29.1% | 709 |
| Weekly | 52 | 0.38% | 18.0% | 820 |
| 1 to 3 times a month | 24 | 0.54% | 12.2% | 878 |
| Less than once a month | 8 | 0.87% | 6.8% | 932 |
Key findings:
- A daily sender loses about three of every four subscribers in a year, even though its per-send rate sits below the weekly rate.
- A twice-weekly sender mails twice as often as a weekly sender and loses 11.1 more points of its list each year.
- The sender who mails less than once a month keeps the most subscribers, 932 of 1,000, and earns the fewest clicks per send.
Our read on this: a sender who mails more often earns more clicks and loses more of the list. A twice-weekly sender who adds new subscribers at more than 29.1% of the list each year can grow while sending twice as often.
Unsubscribe Rate by Email Type
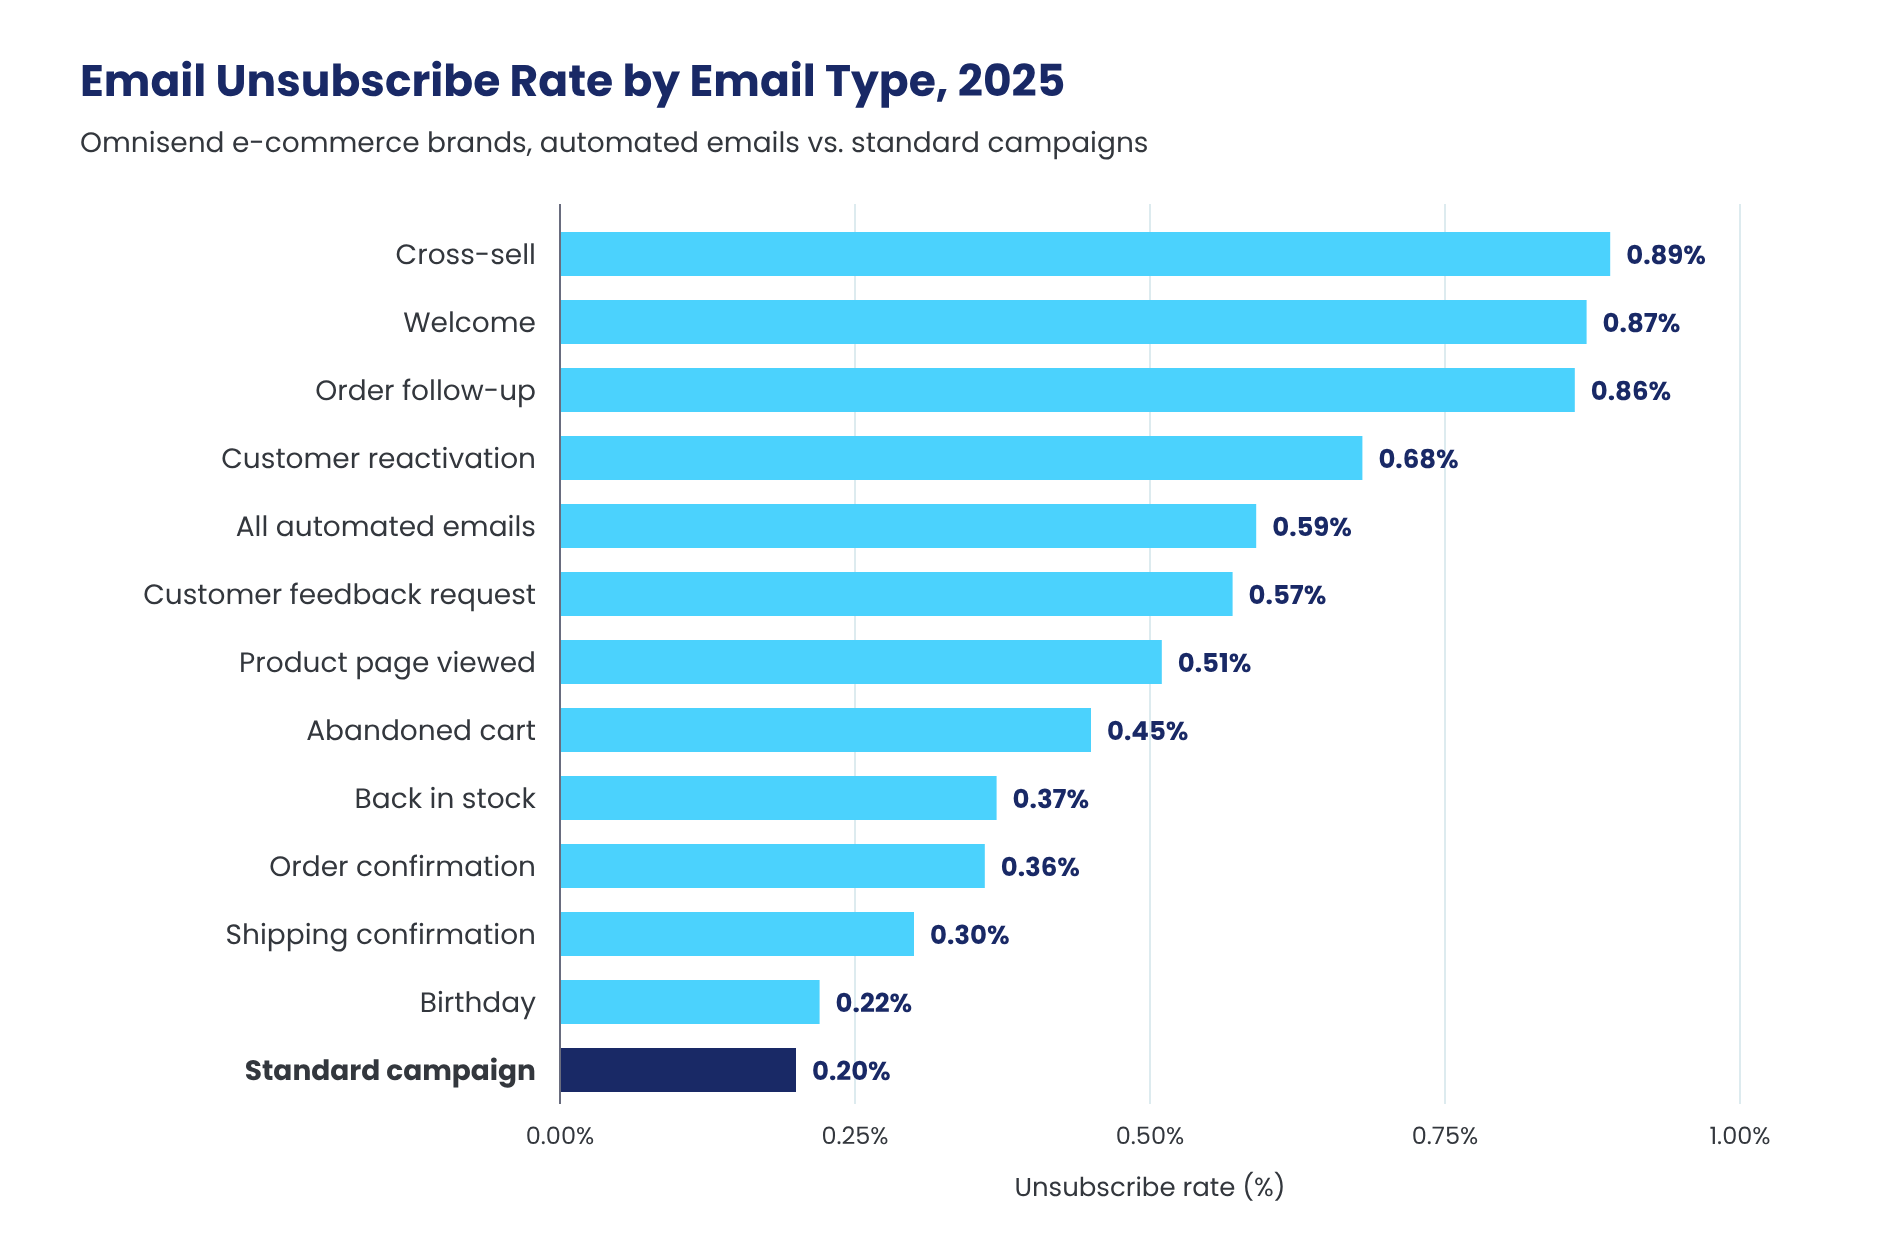
Omnisend measured 20 billion campaign emails and 470 million automated emails from more than 27,000 e-commerce brands in 2025.
| Email type | Unsubscribe rate |
|---|---|
| Standard campaign | 0.20% |
| Birthday | 0.22% |
| Shipping confirmation | 0.30% |
| Order confirmation | 0.36% |
| Back in stock | 0.37% |
| Abandoned cart | 0.45% |
| Product page viewed | 0.51% |
| Customer feedback request | 0.57% |
| Customer reactivation | 0.68% |
| Order follow-up | 0.86% |
| Welcome | 0.87% |
| Cross-sell | 0.89% |
| All automated emails | 0.59% |
Key findings:
- Automated emails lose 2.95x as many recipients as standard campaigns, 0.59% versus 0.20%.
- A new customer who receives an order confirmation, a shipping confirmation, an order follow-up, and a cross-sell email has a 2.39% chance of unsubscribing during that sequence.
- Welcome emails and cross-sell emails each lose more than 4x the standard campaign rate.
Klaviyo’s 2025 benchmarks show the reverse: 0.71% for campaigns and 0.22% for automated flows. Klaviyo’s figures cover only mid-market and enterprise brands.
We think the difference reflects who sends. Larger brands mail big campaign lists that include older, less engaged subscribers, and those subscribers leave when a campaign arrives.
Unsubscribe Rate by Region
| Region | MailerLite median | Brevo average |
|---|---|---|
| Australia | 0.37% | Not reported |
| Europe | 0.23% | 0.51% |
| US and Canada | 0.20% | 0.46% |
| Africa (Brevo: Middle East and Africa) | 0.19% | 0.37% |
| Asia (Brevo: Asia-Pacific) | 0.12% | 0.36% |
| Latin America | 0.10% | 0.23% |
Key findings:
- Australian campaigns lose 0.37% of recipients, 1.85x the US and Canada median.
- Latin America posts the lowest rate in both datasets.
- European senders lose more recipients than North American senders in both datasets.
How Unsubscribe Rates Changed from 2024 to 2025
| Metric (MailerLite median) | 2024 | 2025 | Change |
|---|---|---|---|
| Unsubscribe rate | 0.08% | 0.22% | +175% |
| Click rate | 2.00% | 2.09% | +4.5% |
| Open rate | 42.35% | 43.46% | +2.6% |
Key findings:
- The unsubscribe rate nearly tripled in one year, while click and open rates rose by less than 5%.
- Gmail required bulk senders to add one-click unsubscribe to all promotional email by June 1, 2024, and to honor each request within 48 hours.
- Gmail’s rules also tell senders to keep spam complaints below 0.1% and never reach 0.3%.
MailerLite attributes the rise to Gmail changes that make it easier to unsubscribe from promotional email. We think the one-click option moved subscribers who used to ignore a sender into the unsubscribe count.
Open and click rates rose in the same year. MailerLite links that rise to list cleaning: subscribers who rarely opened or clicked left the lists.
Why Subscribers Unsubscribe
Litmus surveyed 1,000 US consumers in April 2025 about the retail emails they leave.
| Reason for unsubscribing | Share of consumers |
|---|---|
| Emails arrive too often | 67% |
| Content is irrelevant or not personalized | 46% |
| Too many promotions without valuable offers | 42% |
Key findings:
- Frequency outranks irrelevant content by 21 points.
- 32% of consumers prefer one email a week, and 20% prefer two or three a week.
- The 52% who prefer one to three emails a week match the weekly and twice-weekly groups, which both lose less than 0.40% per send.
We think “too often” describes emails that arrive more often than they deliver value. The frequency data fits that reading, since senders who mail less than once a month lose the most recipients per send.
What a Good Email Unsubscribe Rate Looks Like
- Standard campaigns: 0.20% or lower
- Top performers: 0.05% or lower, the rate of Brevo’s top 10% of senders
- Automated emails: 0.59% or lower
- Welcome emails: 0.87% or lower
- Senders who mail weekly or more often: 0.38% or lower
- Losses per click: fewer than 10.5 subscribers per 100 clicks, the figure for all industries combined
How These Figures Are Calculated
- Unsubscribe rate = unsubscribes ÷ delivered emails × 100
- Subscribers lost per 100 clicks = unsubscribe rate ÷ click rate × 100
- Share of list lost in 12 months = 1 − (1 − unsubscribe rate per send)^sends per year
- Chance of unsubscribing during a sequence = 1 − the product of (1 − unsubscribe rate) for each email in the sequence
Further Reading
To get the full dataset, request the report through our contact page.
About the data: This study combines five datasets, all covering 2025:
- 3.6 million campaigns from 181,000 MailerLite accounts
- More than 12 billion emails from 42,000 MailerLite accounts, sorted by send frequency
- 20.5 billion campaign and automated emails from more than 27,000 Omnisend brands
- Benchmarks from more than 175,000 Brevo customers
- A survey of 1,000 US consumers by Litmus
Sources
- Focus Digital Email Unsubscribe Rate Study, 2026. Our calculations from the sources below, explained in the method notes.
- MailerLite, Email Marketing Benchmarks by Industry and Region for 2026
- MailerLite, Email Cadence: How Often Should You Send Emails for Optimum Results?
- Omnisend, Email Marketing Benchmarks: What Good Looks Like in 2026
- Brevo, Email Marketing Benchmarks 2026: Region and Industry Data
- Klaviyo, Enterprise Email Marketing Benchmarks
- Litmus, Why Your Best Marketing Channel Is Driving Customers Away
- Google, Email Sender Guidelines FAQ
- Method notes:
- Industry, region, and year-over-year figures are MailerLite medians for campaigns sent from December 2024 to November 2025. MailerLite does not state the period behind its prior-year 0.08% figure.
- Send frequency figures are MailerLite averages for campaigns sent in 2025.
- Subscribers lost per 100 clicks divides each group’s unsubscribe rate by its click rate. The figure compares group medians or averages and does not track individual campaigns.
- Annual list loss compounds each group’s per-send rate over a year of sends on a fixed list with no new signups, and assumes every subscriber receives every send. Sends per year use 365 for daily, 104 for twice a week, 52 for weekly, 24 for one to three times a month, and 8 for less than once a month.
- Sequence probabilities compound Omnisend’s rate for each email and assume every email reaches the same customer.
- The benchmark comparison table pairs the closest MailerLite and Brevo categories. Restaurants and cafes pair with hospitality and food services. Manufacturing pairs with manufacturing, automotive, and construction. Software and web app pairs with information, technology, and software.