When launching an advertising campaign for a software company, the two most important metrics are customer acquisition cost (CAC) and customer lifetime value (LTV). Many software companies are unaware of what their CAC should be, leading to wasted advertising spend. In this article, we have provided the average CAC for software companies broken down by:
A note on CAC:LTV ratios: We recommend that software companies maintain a CAC:LTV ratio of no less than 1:3, but ideally 1:4 or 1:5. To translate, that means for every $1 spent on marketing, $3, $4, or $5 is returned. Generally, software companies in stages of rapid growth should keep their CAC:LTV ratio around 1:3 to ensure the maximum number of customers possible are being generated without burning money.
However, software companies not looking to grow rapidly should aim for a CAC:LTV ratio of 1:4 or 1:5, as this maintains a healthy margin for the company whilst acquiring new customers at scale. Feel free to reach out to us for specific recommendations on a healthy CAC:LTV ratio, as it can and will vary by each company’s situation.
To calculate your CAC, use the following formula:
CAC = Total Spend on Marketing \ Number of New Customer Acquired
Organic versus Paid: You’ll notice each of our CAC benchmarks with the exception of acquisition channels are split into organic and paid price benchmarks. Paid advertising channels, generally Google Ads, Meta Ads, influencer marketing, and other types of advertising where dollars are traded for impressions along a linear relationship.
Inversely, organic methods include non-paid social media (as in posting content), SEO, and email marketing. These channels compound (when implemented correctly) without incrementally more spend on the channels. For example, an SEO campaign will break even, on average, between 6-8 months after launch for most software companies. But, in year three, ROI commonly tops 1,000%.
Now, here are our software company CAC benchmarks.
Average CAC By Industry
We have subdivided the following industries and provided CACs for each.
Healthcare
| Healthcare | Organic | Paid |
|---|---|---|
| Electronic Health Records (EHR) | $2,575 | $3,890 |
| Telemedicine | $1,617 | $2,387 |
| Medical Imaging | $2,819 | $4,230 |
| Healthcare Management Systems | $2,020 | $3,001 |
Finance and Banking
| Finance and Banking | Organic | Paid |
|---|---|---|
| Fintech Solutions | $1,399 | $2,106 |
| Investment Management | $1,787 | $2,706 |
| Banking Software | $990 | $1,493 |
| Accounting Software | $809 | $1,202 |
Retail and E-commerce
| Retail and E-commerce | Organic | Paid |
|---|---|---|
| E-commerce Platforms | $120 | $179 |
| Point of Sale (POS) Systems | $243 | $362 |
| Inventory Management | $141 | $209 |
| Customer Relationship Management (CRM) | $362 | $538 |
Education
| Education | Organic | Paid |
|---|---|---|
| Learning Management Systems (LMS) | $481 | $722 |
| Virtual Classrooms | $239 | $359 |
| Student Information Systems | $523 | $785 |
| Educational Content Delivery | $202 | $298 |
Manufacturing
| Manufacturing | Organic | Paid |
|---|---|---|
| Enterprise Resource Planning (ERP) | $2,816 | $4,169 |
| Supply Chain Management | $2,175 | $3,275 |
| Manufacturing Execution Systems (MES) | $2,792 | $4,208 |
| Quality Management Systems | $1,614 | $2,402 |
Real Estate
| Real Estate | Organic | Paid |
|---|---|---|
| Property Management | $1,012 | $1,490 |
| Real Estate CRM | $515 | $779 |
| Virtual Tour Software | $359 | $537 |
| Real Estate Analytics | $803 | $1,205 |
Transportation and Logistics
| Transportation and Logistics | Organic | Paid |
|---|---|---|
| Fleet Management | $1,385 | $2,092 |
| Logistics and Supply Chain Solutions | $1,592 | $2,418 |
| Transportation Management Systems (TMS) | $1,395 | $2,083 |
| Route Optimization Software | $1,006 | $1,505 |
Hospitality and Tourism
| Hospitality and Tourism | Organic | Paid |
|---|---|---|
| Hotel Management Software | $674 | $1,021 |
| Travel Booking Systems | $445 | $658 |
| Event Management | $476 | $721 |
| Customer Feedback Systems | $238 | $360 |
Media and Entertainment
| Media and Entertainment | Organic | Paid |
|---|---|---|
| Content Management Systems (CMS) | $476 | $723 |
| Streaming Platforms | $999 | $1,501 |
| Digital Asset Management | $727 | $1,075 |
| Video Editing and Production Software | $239 | $358 |
Telecommunications
| Telecommunications | Organic | Paid |
|---|---|---|
| Network Management | $519 | $782 |
| Customer Billing Systems | $402 | $597 |
| VoIP Solutions | $243 | $361 |
| Customer Support Software | $239 | $357 |
Legal
| Legal | Organic | Paid |
|---|---|---|
| Case Management | $1,008 | $1,497 |
| Document Management | $521 | $775 |
| Legal Research Tools | $398 | $604 |
| Time Tracking and Billing | $479 | $718 |
Construction
| Construction | Organic | Paid |
|---|---|---|
| Project Management | $1,616 | $2,384 |
| BIM (Building Information Modeling) | $2,212 | $3,276 |
| Construction Estimating | $1,581 | $2,384 |
| Field Service Management | $1,402 | $2,110 |
Energy and Utilities
| Energy and Utilities | Organic | Paid |
|---|---|---|
| Energy Management Systems | $1,593 | $2,382 |
| Utility Billing Software | $1,006 | $1,501 |
| Grid Management | $2,189 | $3,294 |
| Renewable Energy Software | $1,200 | $1,808 |
Agriculture
| Agriculture | Organic | Paid |
|---|---|---|
| Farm Management Software | $1,009 | $1,496 |
| Precision Agriculture | $989 | $1,511 |
| Agricultural Marketplaces | $721 | $1,073 |
| Supply Chain and Logistics | $1,021 | $1,491 |
Government
| Government | Organic | Paid |
|---|---|---|
| Public Sector ERP | $2,392 | $3,600 |
| Citizen Engagement Platforms | $1,004 | $1,494 |
| Permit and Licensing Systems | $1,008 | $1,490 |
| Emergency Management Software | $1,590 | $2,413 |
Nonprofits
| Nonprofit | Organic | Paid |
|---|---|---|
| Donor Management Systems | $475 | $714 |
| Fundraising Software | $240 | $361 |
| Volunteer Management | $237 | $359 |
| Grant Management | $239 | $358 |
Human Resources
| Human Resources | Organic | Paid |
|---|---|---|
| HR Management Systems (HRMS) | $714 | $1,079 |
| Recruitment Software | $485 | $716 |
| Payroll Solutions | $398 | $603 |
| Employee Engagement Platforms | $397 | $597 |
Technology
| Technology | Organic | Paid |
|---|---|---|
| IT Service Management (ITSM) | $1,187 | $1,799 |
| Software Development Tools | $481 | $719 |
| Cybersecurity Solutions | $1,001 | $1,496 |
| Cloud Services and Infrastructure | $1,007 | $1,511 |
Food and Beverage
| Food and Beverage | Organic | Paid |
|---|---|---|
| Restaurant Management Systems | $240 | $360 |
| Food Delivery Platforms | $141 | $209 |
| Inventory Management | $200 | $301 |
| Recipe and Menu Management | $141 | $209 |
Average CAC By Market Size
Generally, a smaller market necessitates a more expensive product as CACs rise with a smaller market.
| Market Size | Description | Organic | Paid |
|---|---|---|---|
| Small | Local or niche markets with specific focus | $442 | $661 |
| Medium | Regional or mid-sized enterprises | $2,404 | $3,580 |
| Large | National or large enterprises with significant market presence | $10,052 | $14,915 |
| Global | International or global enterprises with widespread presence | $47,556 | $71,591 |
Average CAC by Customer Size
Whether the software company primarily serves small businesses, mid-size businesses, or enterprise companies will heavily affect the CAC.
| Customer Size | Description | Organic | Paid |
|---|---|---|---|
| Small Business | Companies with fewer than 50 employees | $441 | $663 |
| Medium Business | Companies with 50 to 500 employees | $2,375 | $3,620 |
| Large Business | Companies with 500 to 5,000 employees | $10,110 | $14,936 |
| Enterprise | Companies with over 5,000 employees | $47,938 | $72,006 |
Average CAC by Sales Model
Some companies utilize more labor-intensive sales approaches, which lead to higher CACs.
| Sales Model | Description | Organic | Paid |
|---|---|---|---|
| Self Service | Customers purchase without sales interaction | $441 | $663 |
| Inside Sales | Sales conducted remotely via phone, email, or online | $2,388 | $3,591 |
| Field Sales | High-touch sales with in-person meetings and interactions | $10,056 | $15,122 |
| Channel Sales | Sales through partners, resellers, or distributors | $4,824 | $7,195 |
Average CAC by Adoption Stage
Companies taking on early adopters as customers will inevitably experience higher CACs as a larger percentage of advertising spend must go towards problem education.
| Adoption Stage | Description | Organic | Paid |
|---|---|---|---|
| Early Adopters | Customers who are quick to adopt new technologies | $4,747 | $7,258 |
| Early Majority | Customers who adopt new technologies after seeing some success | $3,597 | $5,417 |
| Late Majority | Customers who adopt new technologies once they are well-established | $2,386 | $3,615 |
| Laggards | Customers who are slow to adopt new technologies | $1,197 | $1,800 |
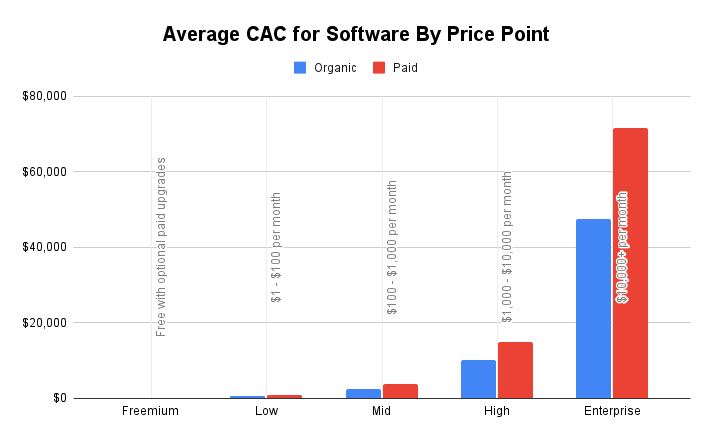
Average CAC by Price Point
Below is our analysis of various software companies selling products in various price ranges and their average CACs. Your company may have several pricing tiers, in which case CACs should be tracked separately for each pricing tier and measured against these accordingly.
| Price Point | Description | Organic | Paid |
|---|---|---|---|
| Freemium | Free with optional paid upgrades | $40 | $60 |
| Low | $1 – $100 per month | $444 | $656 |
| Mid | $100 – $1,000 per month | $2,407 | $3,572 |
| High | $1,000 – $10,000 per month | $9,903 | $14,885 |
| Enterprise | $10,000+ per month | $47,623 | $71,717 |
Average CAC by Acquisition Channel
There is a wide spread in the average CAC across the most common acquisition channels. Generally the lower the CAC, the longer a company must invest in the channel before yielding a result.
| Acquisition Channel | CAC |
|---|---|
| SEO | $927 |
| Email Marketing | $695 |
| PPC | $1,390 |
| Organic Social Media | $1,158 |
| Conferences & Events | $1,622 |
| Direct Sales | $1,854 |
| Affiliate Marketing | $2,085 |
Final Thoughts: Lowering Your CAC
The best way to lower your CAC, at a high level, is to optimize marketing spend towards channels acquiring customers at cheaper CACs. For most companies, this will mean leaning into a thought leadership SEO campaign. SEO consistently generates new customers across industries at lower costs than nearly any other marketing campaign type.
If website traffic is high through other sources such as referrals from other websites or traffic sources such as Google Ads or Meta, consider split testing the copy on the primarily landing pages on the website and optimizing down primary conversion paths.
For more information on SEO or a copy of this report, please reach out to us on our Contact Us page.