
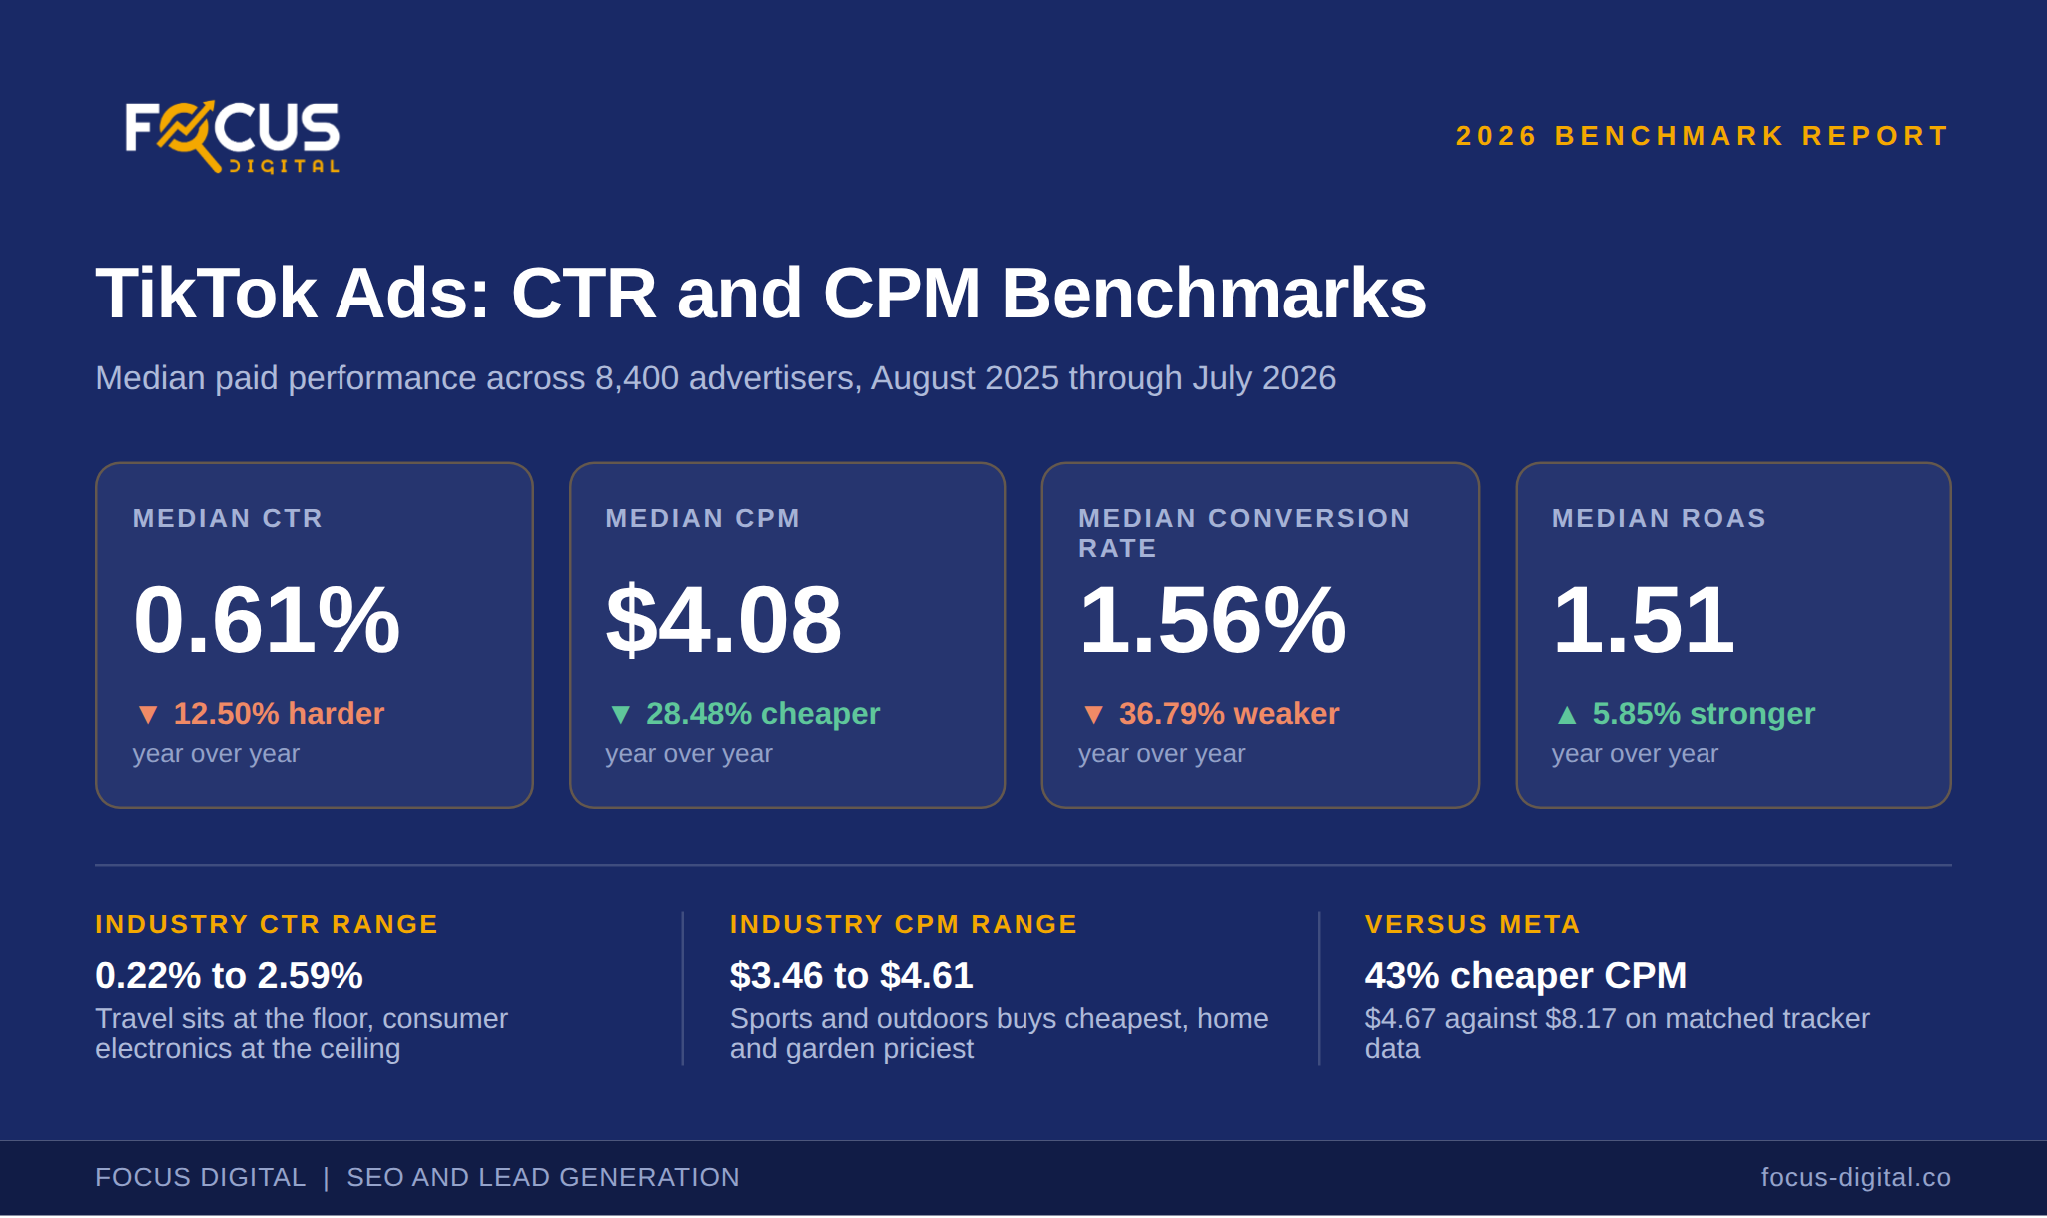
TikTok ads earn a 0.61% median click-through rate at a $4.08 median CPM, and industry CTR ranges from 0.22% in travel to 2.59% in consumer electronics, while CPM runs between $3.46 and $4.61.
Our research team kept only the datasets that publish their own sample and period, then discarded figures with no traceable origin. The benchmarks below draw on 8,400 advertisers and a cost tracker built on tens of billions of impressions.
Key Insights:
 Key Insights:
Key Insights:
Key Insights:
Key Insights:
Key Takeaways
- Median CPM fell 28.48% to $4.08 over the past year while median CTR slipped 12.50% to 0.61%, so reach got cheaper as attention got harder to win.
- Industry moves CTR by a factor of nearly 12, from 0.22% in travel to 2.59% in consumer electronics.
- TikTok’s $4.67 CPM undercuts Meta’s $8.17 by 43%, though Meta turns impressions into clicks at 1.77% against TikTok’s 0.95%.
- Thursday impressions cost 33% more than Saturday impressions at $4.83 against $3.63, and Black Friday pushed CPM to $6.26.
TikTok Advertising Benchmarks for 2026
Every headline TikTok metric except return on ad spend moved down over the past year, suggesting cheaper impressions came with weaker purchase intent. The table below sets the platform-wide baseline across 5,900 brands.| Metric | Aug 2025 to Jul 2026 | Prior 12 Months | Change |
|---|---|---|---|
| Median CTR | 0.61% | 0.70% | -12.50% |
| Median CPM | $4.08 | $5.71 | -28.48% |
| Median conversion rate | 1.56% | 2.46% | -36.79% |
| Median cost per acquisition | $17.07 | $24.86 | -31.36% |
| Median ROAS | 1.51 | 1.43 | +5.85% |
| Median average order value | $50.32 | $46.90 | +7.29% |
- CPM fell more than twice as fast as CTR, so impressions got cheaper faster than clicks got scarce, and conversion rate carried the real decline at -36.79%.
- A separate ecommerce dataset puts median CPM at $4.80 and median CTR at 0.61%, which confirms the click figure and brackets the cost.
CTR and CPM by Ecommerce Industry
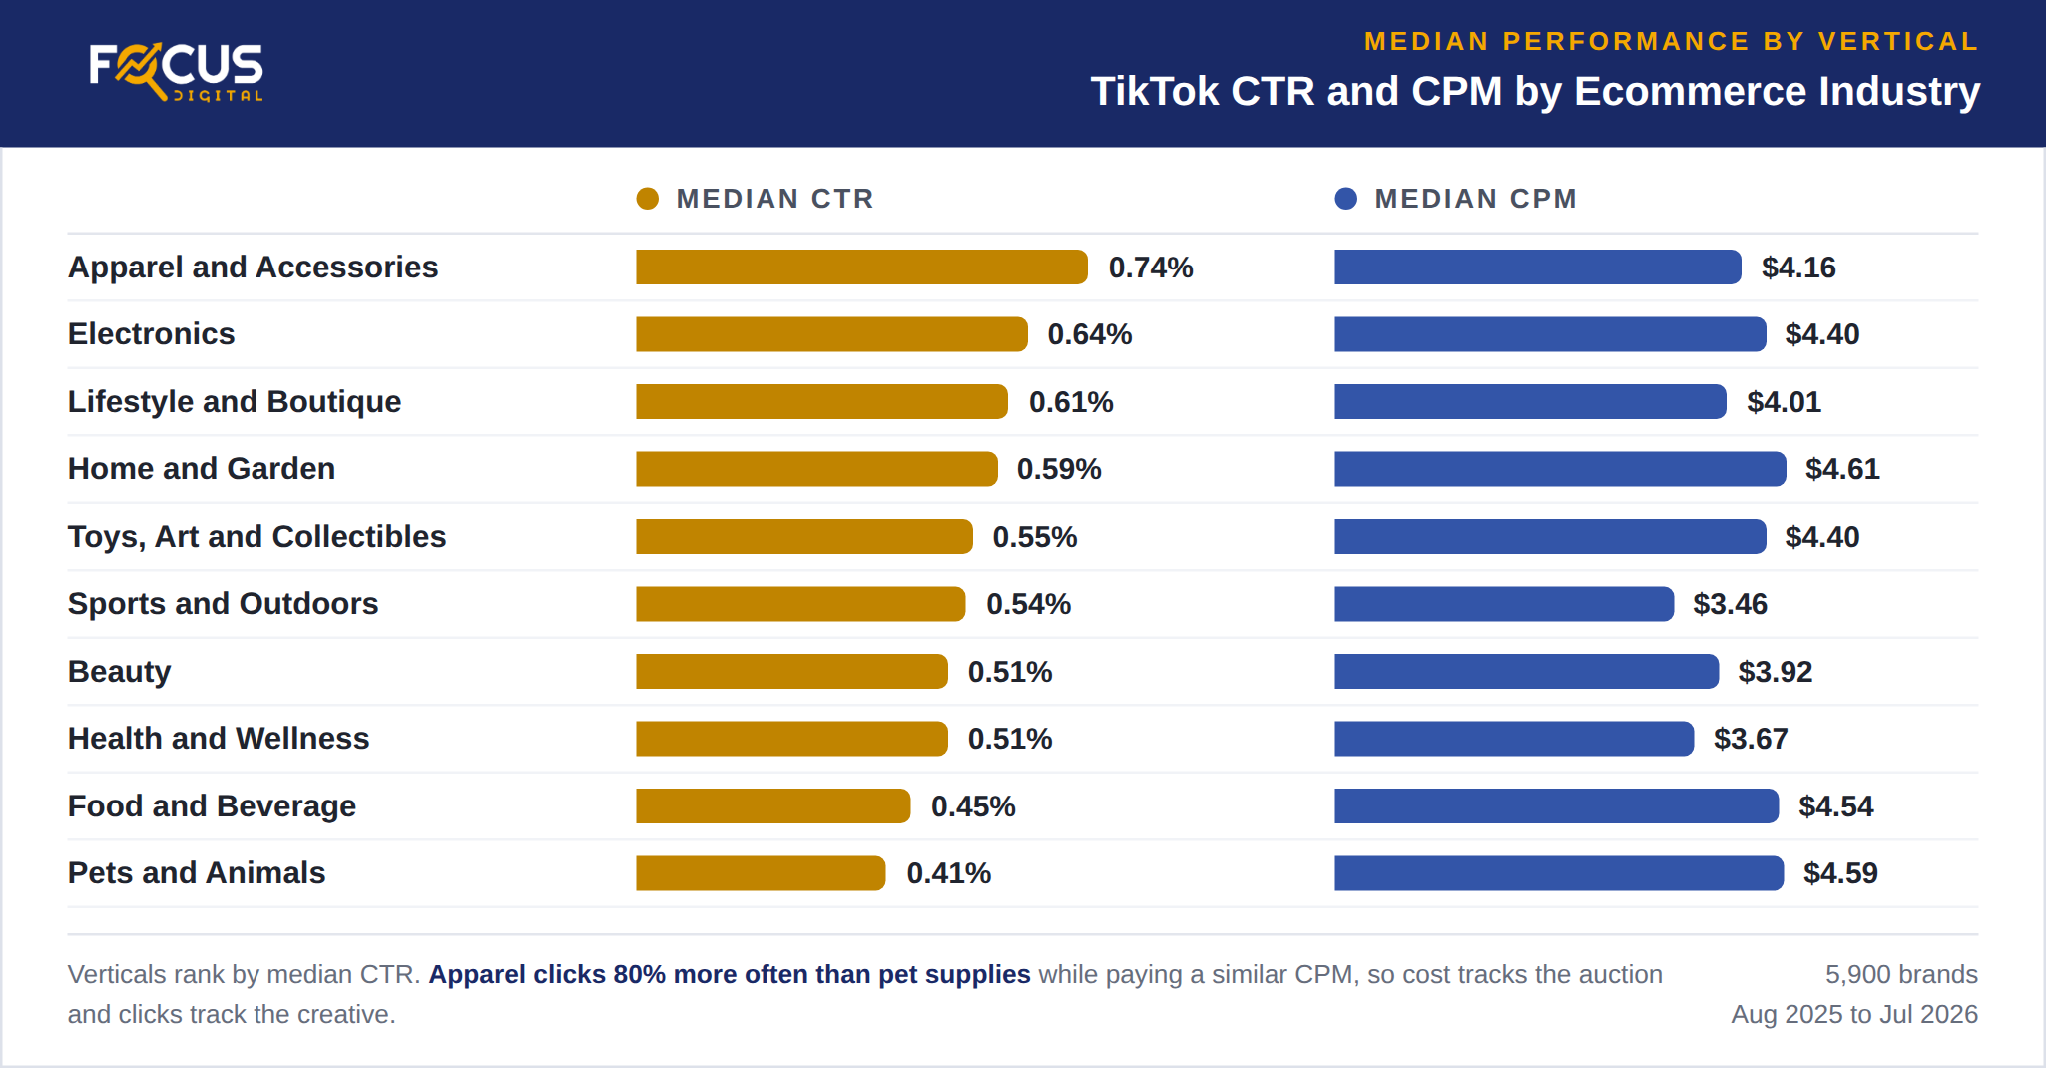
Product category predicts CTR better than budget size does because category determines how closely an ad resembles the surrounding entertainment, which lifts apparel and sinks pet supplies. Our data indicates the following spread across ten retail verticals.
Key Insights:
- Home and garden pays the highest CPM at $4.61 and still returns a 2.02 ROAS, while health and wellness buys among the cheapest impressions at $3.67 and returns 0.42.
- CPM varies by only $1.15 across all ten verticals, so creative performance moves results far more than auction competition does, and pet brands prove the point with a 30.17% CTR decline against apparel’s 3.62% gain.
CTR and CPC by Service and B2B Industry
Lead generation advertisers sit outside retail benchmarks, and their numbers diverge once the offer asks for a form fill instead of a purchase. The 2,500 advertisers behind these medians reported through the full 2025 calendar year. In our analysis below, 16 verticals rank by median click-through rate.| Industry | Median CTR | Median CPC |
|---|---|---|
| Consumer Electronics | 2.59% | $0.12 |
| Transport | 1.62% | $0.56 |
| Internet Finance | 1.36% | $0.08 |
| Retail and E-commerce | 0.82% | $0.26 |
| Machinery Equipment | 0.76% | $0.10 |
| Healthcare and Pharmaceutical | 0.69% | $0.30 |
| Automotive | 0.59% | $0.58 |
| Media and Content | 0.56% | $0.24 |
| Education and Training | 0.42% | $0.49 |
| Electronics and Electrical | 0.42% | $0.98 |
| Professional Services | 0.40% | $1.04 |
| Traditional Finance | 0.35% | $0.49 |
| Utility Software | 0.34% | $1.22 |
| Real Estate | 0.31% | $0.66 |
| Telecommunications | 0.26% | $0.72 |
| Travel | 0.22% | $0.98 |
- Utility software and professional services pay the most per click ($1.22 and $1.04) while clicking at 0.34% and 0.40%, the hardest pairing on the platform.
- Healthcare advertisers beat the platform median with a 0.69% CTR at a $0.30 CPC, which prices patient acquisition below most retail categories.
TikTok CPM Against Other Paid Social Platforms
Buyers comparing paid social budgets need cost and click quality in one view, because cheap impressions lose their advantage when nobody acts on them. The table below prices five platforms through a single tracker for October 2025.| Platform | Average CPM | Cost Per Link Click | Link CTR |
|---|---|---|---|
| TikTok | $4.67 | $0.49 | 0.95% |
| $4.67 | Not reported | Not reported | |
| YouTube | $7.61 | Not reported | Not reported |
| Meta | $8.17 | $0.37 | 1.77% |
| Snapchat | $12.84 | $0.51 | 2.50% |
- TikTok buys impressions 43% below Meta, yet Meta converts those impressions into clicks at nearly twice the rate, which drops its cost per click to $0.37 against $0.49.
- Snapchat charges $12.84 per thousand impressions and returns the group’s highest 2.50% link CTR, so engagement and price climb together, and a purchase-optimized ecommerce dataset widens TikTok’s advantage further by pricing Meta at a $15.06 median CPM.
When TikTok CPM Rises and Falls
Auction pressure tracks the calendar, and advertisers who shift budget by day or by quarter capture double-digit savings without touching creative. Our analysis below prices the swing across three years of tracker data.| Period | Average CPM |
|---|---|
| Saturday | $3.63 |
| Sunday | $3.69 |
| Monday | $3.88 |
| Friday | $3.93 |
| Tuesday | $3.95 |
| Wednesday | $3.98 |
| Thursday | $4.83 |
| Full-year 2025 average | $4.82 |
| Cheapest month (January 2025) | $2.87 |
| Priciest month (October 2024) | $5.84 |
| Black Friday 2024 | $6.26 |
| Cyber Monday 2024 | $6.28 |
- Saturday impressions cost 25% less than Thursday impressions, the largest scheduling lever available at no creative cost.
- Q4 carries a 22% to 30% premium over the rest of the year, and peak weekend pricing more than doubles the January floor.
Further Reading
- Average CTR for Social Media Ads: 2026 Benchmarks
- Average CTR for Facebook Ads: 2026 Industry Benchmarks Report
- Facebook Ads Average Conversion Rate
- Average YouTube CTR: Organic and Paid Benchmarks
- Average CTR for Programmatic Display
- Average Cost Per Qualified Lead: 2026 Report