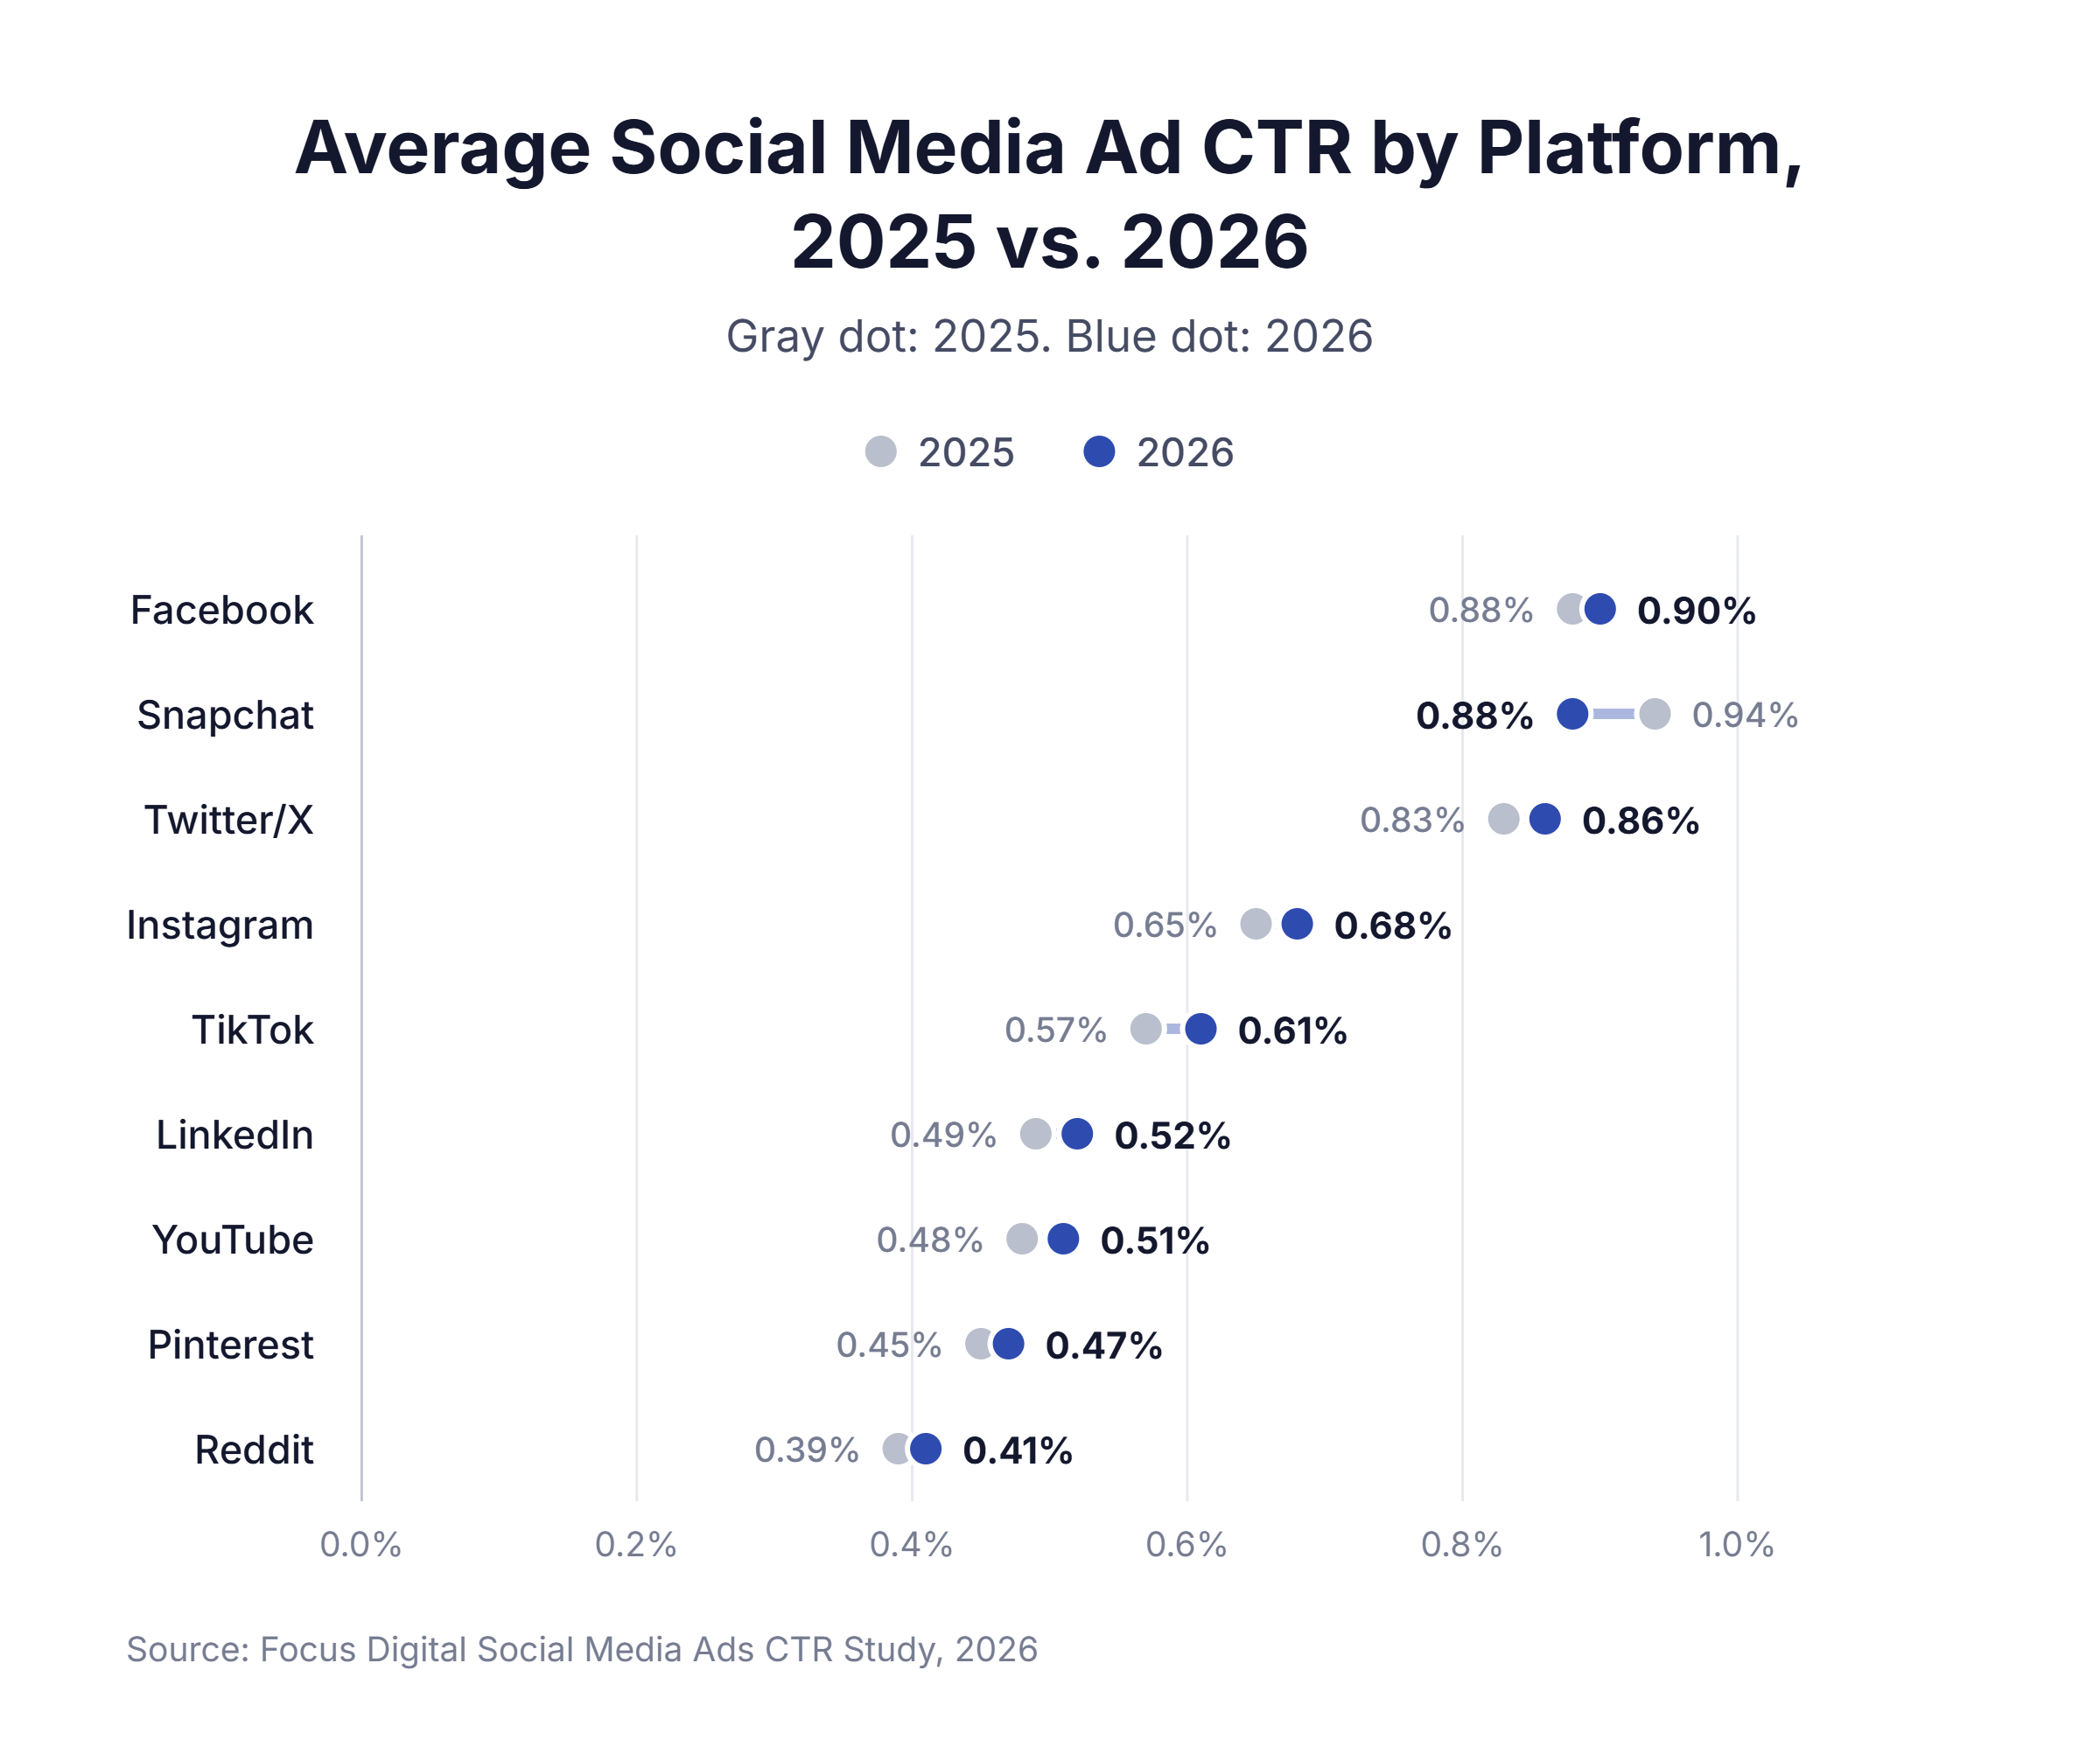
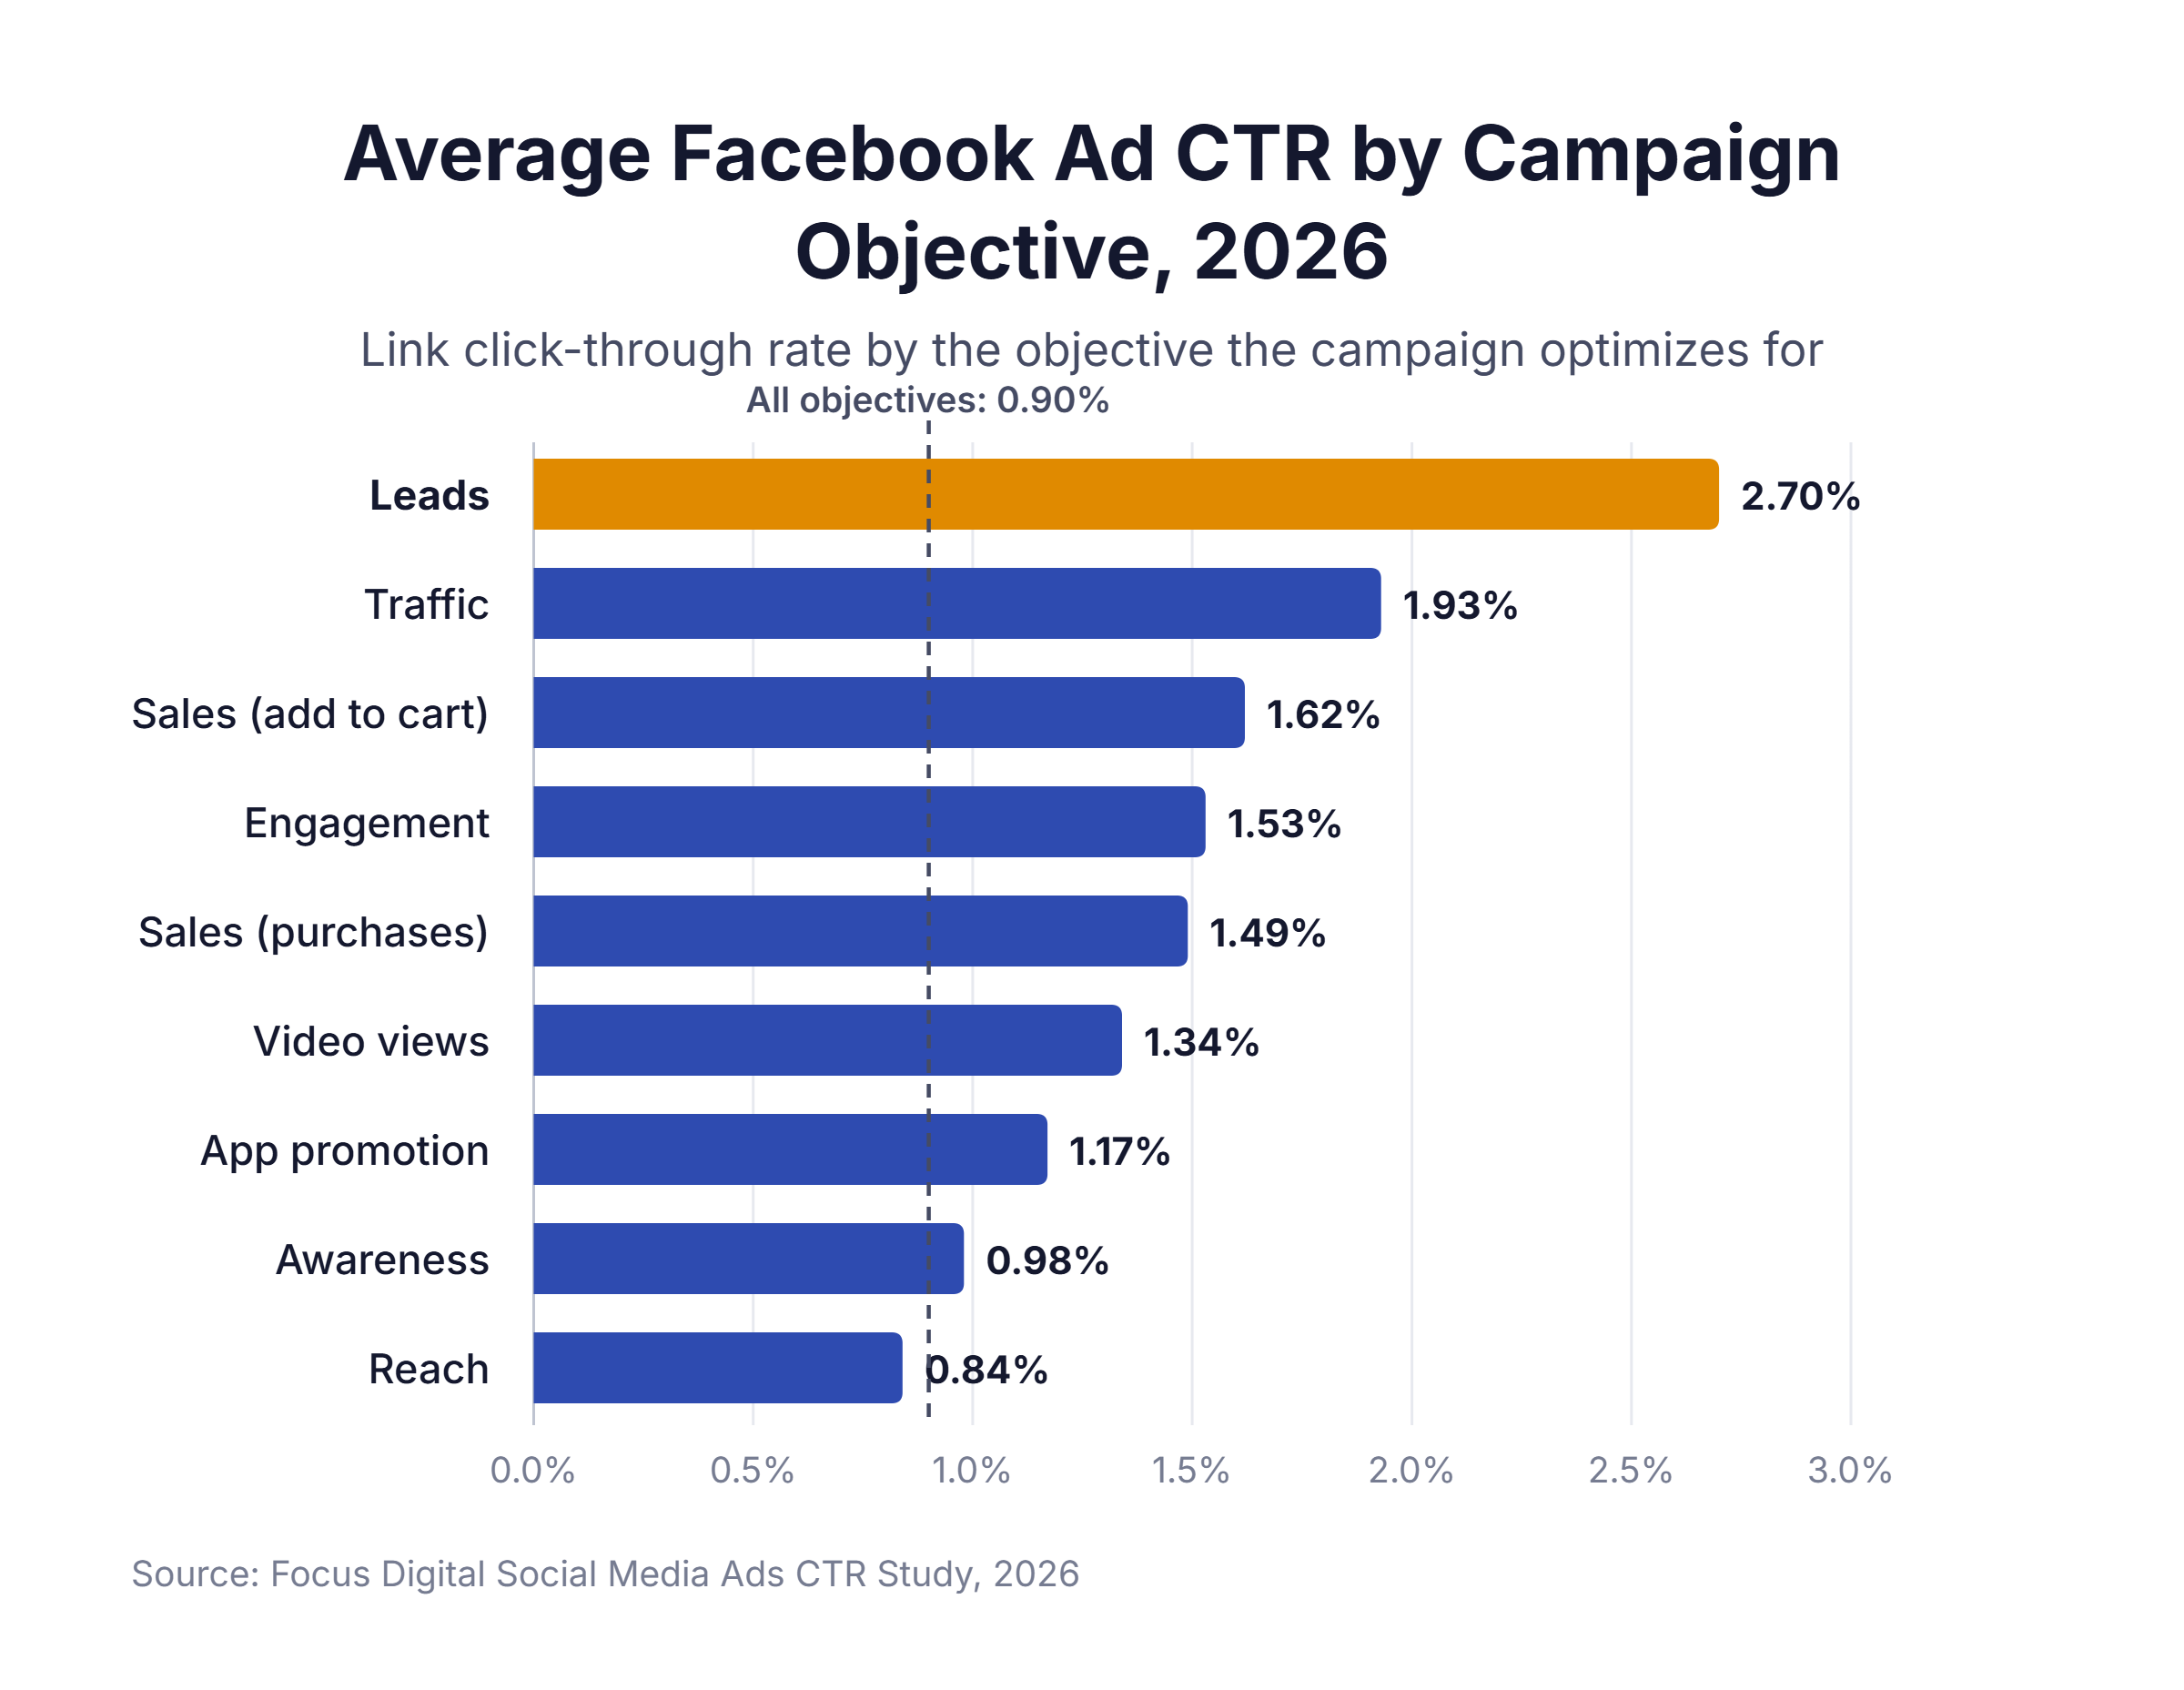
The average click-through rate (CTR) for social media ads is 0.90% on Facebook, 0.86% on X, 0.68% on Instagram, 0.61% on TikTok, and 0.52% on LinkedIn across all campaign objectives. Facebook traffic campaigns average 1.93% and lead campaigns average 2.70% in 2026.
We studied social media ad CTR by platform, campaign objective, industry, ad format, and device, then tracked what paid social visitors do after the click across 104 websites, where they engaged less often in 2026 even as CTR rose.
Key takeaways:
- Facebook ads average a 0.90% click-through rate, 0.38 percentage points above LinkedIn’s 0.52%.
- Facebook lead generation campaigns average 2.70% CTR, three times the all-objective Facebook average.
- LinkedIn thought leader ads earn a 2.68% CTR, six times the rate of single image ads.
- Instagram feed video earns 44.26% more clicks per impression than single image ads.
- A paid social click converts at 19.23% of the rate of a Google Ads click on the same website.
- The share of engaged paid social visits fell from 44.13% to 34.88% in a year on the same websites.
In this report:
- Benchmarks: CTR by platform, what a good CTR is, and CTR by Facebook campaign objective
- Breakdowns: CTR by industry, LinkedIn by industry, Instagram by ad format, and mobile vs. desktop
- After the click: visitor quality vs. Google Ads, why CTR is low, and how to raise it
Average CTR for Social Media Ads by Platform
Facebook earns the highest click-through rate among major social platforms, and Reddit earns the lowest.
| Platform | 2026 CTR | 2025 CTR | Change | Campaign Type |
|---|---|---|---|---|
| 0.90% | 0.88% | +0.02 points | All Objectives | |
| Snapchat | 0.88% | 0.94% | -0.06 points | Snap Ads |
| Twitter/X | 0.86% | 0.83% | +0.03 points | Promoted Posts |
| 0.68% | 0.65% | +0.03 points | Feed & Stories | |
| TikTok | 0.61% | 0.57% | +0.04 points | In-Feed Ads |
| 0.52% | 0.49% | +0.03 points | Sponsored Content | |
| YouTube | 0.51% | 0.48% | +0.03 points | In-Stream Ads |
| 0.47% | 0.45% | +0.02 points | Promoted Pins | |
| 0.41% | 0.39% | +0.02 points | Promoted Posts |
Key Research Findings:
- CTR rose on every platform except Snapchat. TikTok gained the most, up 7.01% from 2025. Snapchat’s drop follows its January 2026 change to how it counts clicks, which cut reported clicks by an average of 7.56%.
- Platform choice changes CTR less than objective or format. Facebook and X sit 0.04 points apart, while Facebook lead campaigns earn three times the platform average and LinkedIn thought leader ads earn six times its single image rate.
- TikTok clicks cost about the same as Facebook clicks. TikTok earns about two-thirds of Facebook’s CTR, and its impressions cost roughly 30% less, so the cost of each click comes out within a few percent of Facebook’s.
- LinkedIn trades clicks for job titles. We believe LinkedIn’s 0.52% CTR reflects a work audience scrolling during business hours, which advertisers accept in exchange for targeting by role and company.
What Is a Good CTR for Social Media Ads?
A good CTR depends on the platform. Use these 2026 ranges to grade a campaign against others on the same platform.
| Platform | Below Average | Average | Good (Top 25%) |
|---|---|---|---|
| Under 0.63% | 0.90% | Above 1.35% | |
| Snapchat | Under 0.61% | 0.88% | Above 1.32% |
| Twitter/X | Under 0.59% | 0.86% | Above 1.29% |
| Under 0.47% | 0.68% | Above 1.02% | |
| TikTok | Under 0.42% | 0.61% | Above 0.91% |
| Under 0.36% | 0.52% | Above 0.78% | |
| YouTube | Under 0.35% | 0.51% | Above 0.76% |
| Under 0.32% | 0.47% | Above 0.69% | |
| Under 0.28% | 0.41% | Above 0.61% |
Key Research Findings:
- Grade campaigns by objective first. A Facebook campaign at 1.35% sits 0.58 points below the traffic objective average and 0.37 points above the awareness average, so the same CTR can be weak or strong.
- Clicks are only half the grade. An engaged session rate above 34.85% puts your paid social traffic ahead of the median website in our data, which tells you whether those clicks came from real prospects.
Average Facebook Ad CTR by Campaign Objective
The 0.90% all-objective figure blends every campaign objective. Meta shows each campaign to the people most likely to take the action it optimizes for, so CTR depends heavily on the objective you pick.
| Campaign Objective | Optimizes For | 2026 CTR | 2025 CTR | Change |
|---|---|---|---|---|
| Leads | Form submissions | 2.70% | 2.59% | +4.24% |
| Traffic | Link clicks | 1.93% | 1.71% | +12.86% |
| Sales (add to cart) | Add-to-cart events | 1.62% | 1.51% | +7.28% |
| Engagement | Likes, comments, and shares | 1.53% | 1.42% | +7.74% |
| Sales (purchases) | Completed purchases | 1.49% | 1.38% | +7.97% |
| Video views | ThruPlays | 1.34% | 1.21% | +10.74% |
| App promotion | App installs | 1.17% | 1.09% | +7.33% |
| Awareness | Ad recall | 0.98% | 0.94% | +4.25% |
| Reach | Unique people reached | 0.84% | 0.82% | +2.43% |
Key Research Findings:
- Campaigns that ask for a click get one. Lead and traffic campaigns earn two to three times the CTR of awareness and reach campaigns, which Meta shows to the widest audience at the lowest cost.
- Purchase campaigns trade clicks for buyers. Purchase campaigns earn 0.13 points less CTR than add-to-cart campaigns, because Meta aims them at the smaller group of people likely to buy.
- Advertisers pay less for each visitor. Traffic campaigns gained 0.22 percentage points of CTR in 2026 while cost per click fell 14.28%, from $0.70 to $0.60.
- Lead costs held steady. Lead generation campaigns cost $27.39 per lead, within $0.27 of the 2025 median.
- More clicks did not bring better visitors. Paid social visitors in our data engaged less often in 2026 even as CTR rose (see “What Happens After the Click” below).
Average Social Media Ad CTR by Industry
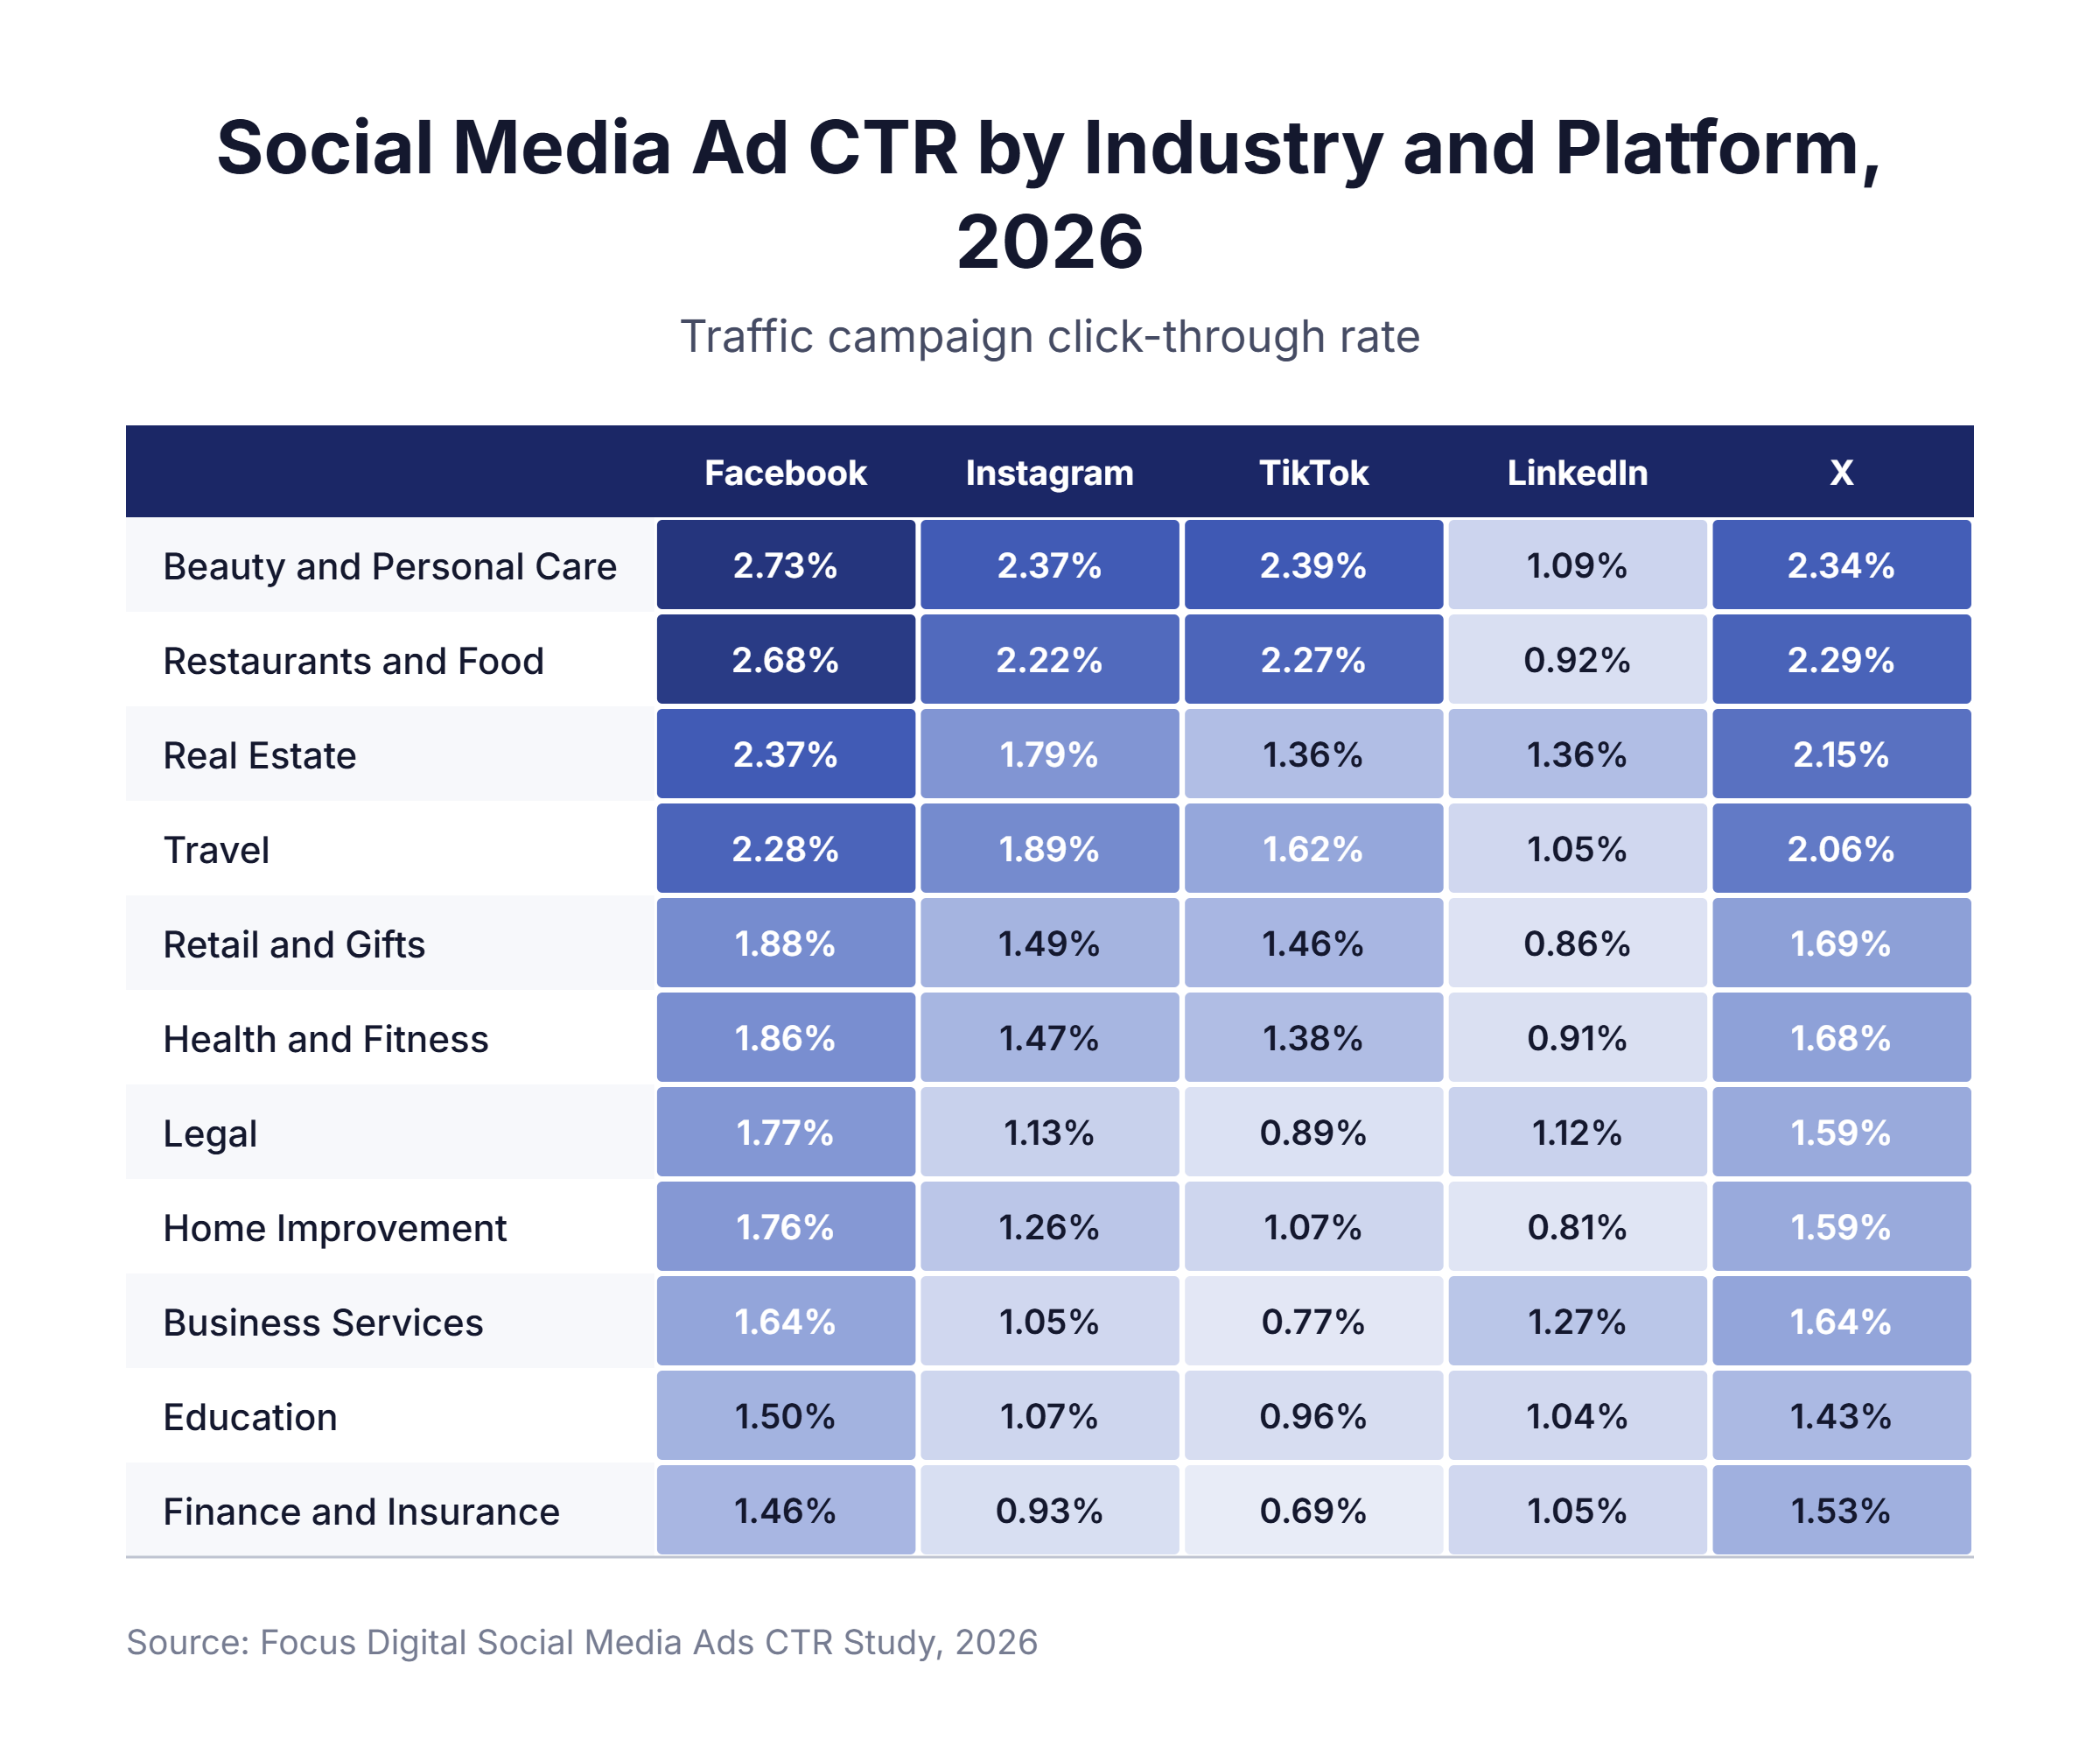
Beauty and restaurant brands earn the highest traffic campaign CTRs on every consumer platform, while LinkedIn reverses the order.
| Industry | TikTok | X | |||
|---|---|---|---|---|---|
| Beauty & Personal Care | 2.73% | 2.37% | 2.39% | 1.09% | 2.34% |
| Restaurants & Food | 2.68% | 2.22% | 2.27% | 0.92% | 2.29% |
| Real Estate | 2.37% | 1.79% | 1.36% | 1.36% | 2.15% |
| Travel | 2.28% | 1.89% | 1.62% | 1.05% | 2.06% |
| Retail & Gifts | 1.88% | 1.49% | 1.46% | 0.86% | 1.69% |
| Health & Fitness | 1.86% | 1.47% | 1.38% | 0.91% | 1.68% |
| Legal | 1.77% | 1.13% | 0.89% | 1.12% | 1.59% |
| Home Improvement | 1.76% | 1.26% | 1.07% | 0.81% | 1.59% |
| Business Services | 1.64% | 1.05% | 0.77% | 1.27% | 1.64% |
| Education | 1.50% | 1.07% | 0.96% | 1.04% | 1.43% |
| Finance & Insurance | 1.46% | 0.93% | 0.69% | 1.05% | 1.53% |
Key Research Findings:
- Beauty and restaurants lead on every consumer platform. The two industries rank first and second on Facebook, Instagram, TikTok, and X.
- LinkedIn flips the ranking. Real estate (1.36%) and business services (1.27%) lead LinkedIn, while restaurants and home improvement fall below 1%.
- TikTok rewards consumer brands the most. TikTok shows the widest spread of any platform, from 2.39% for beauty to 0.69% for finance.
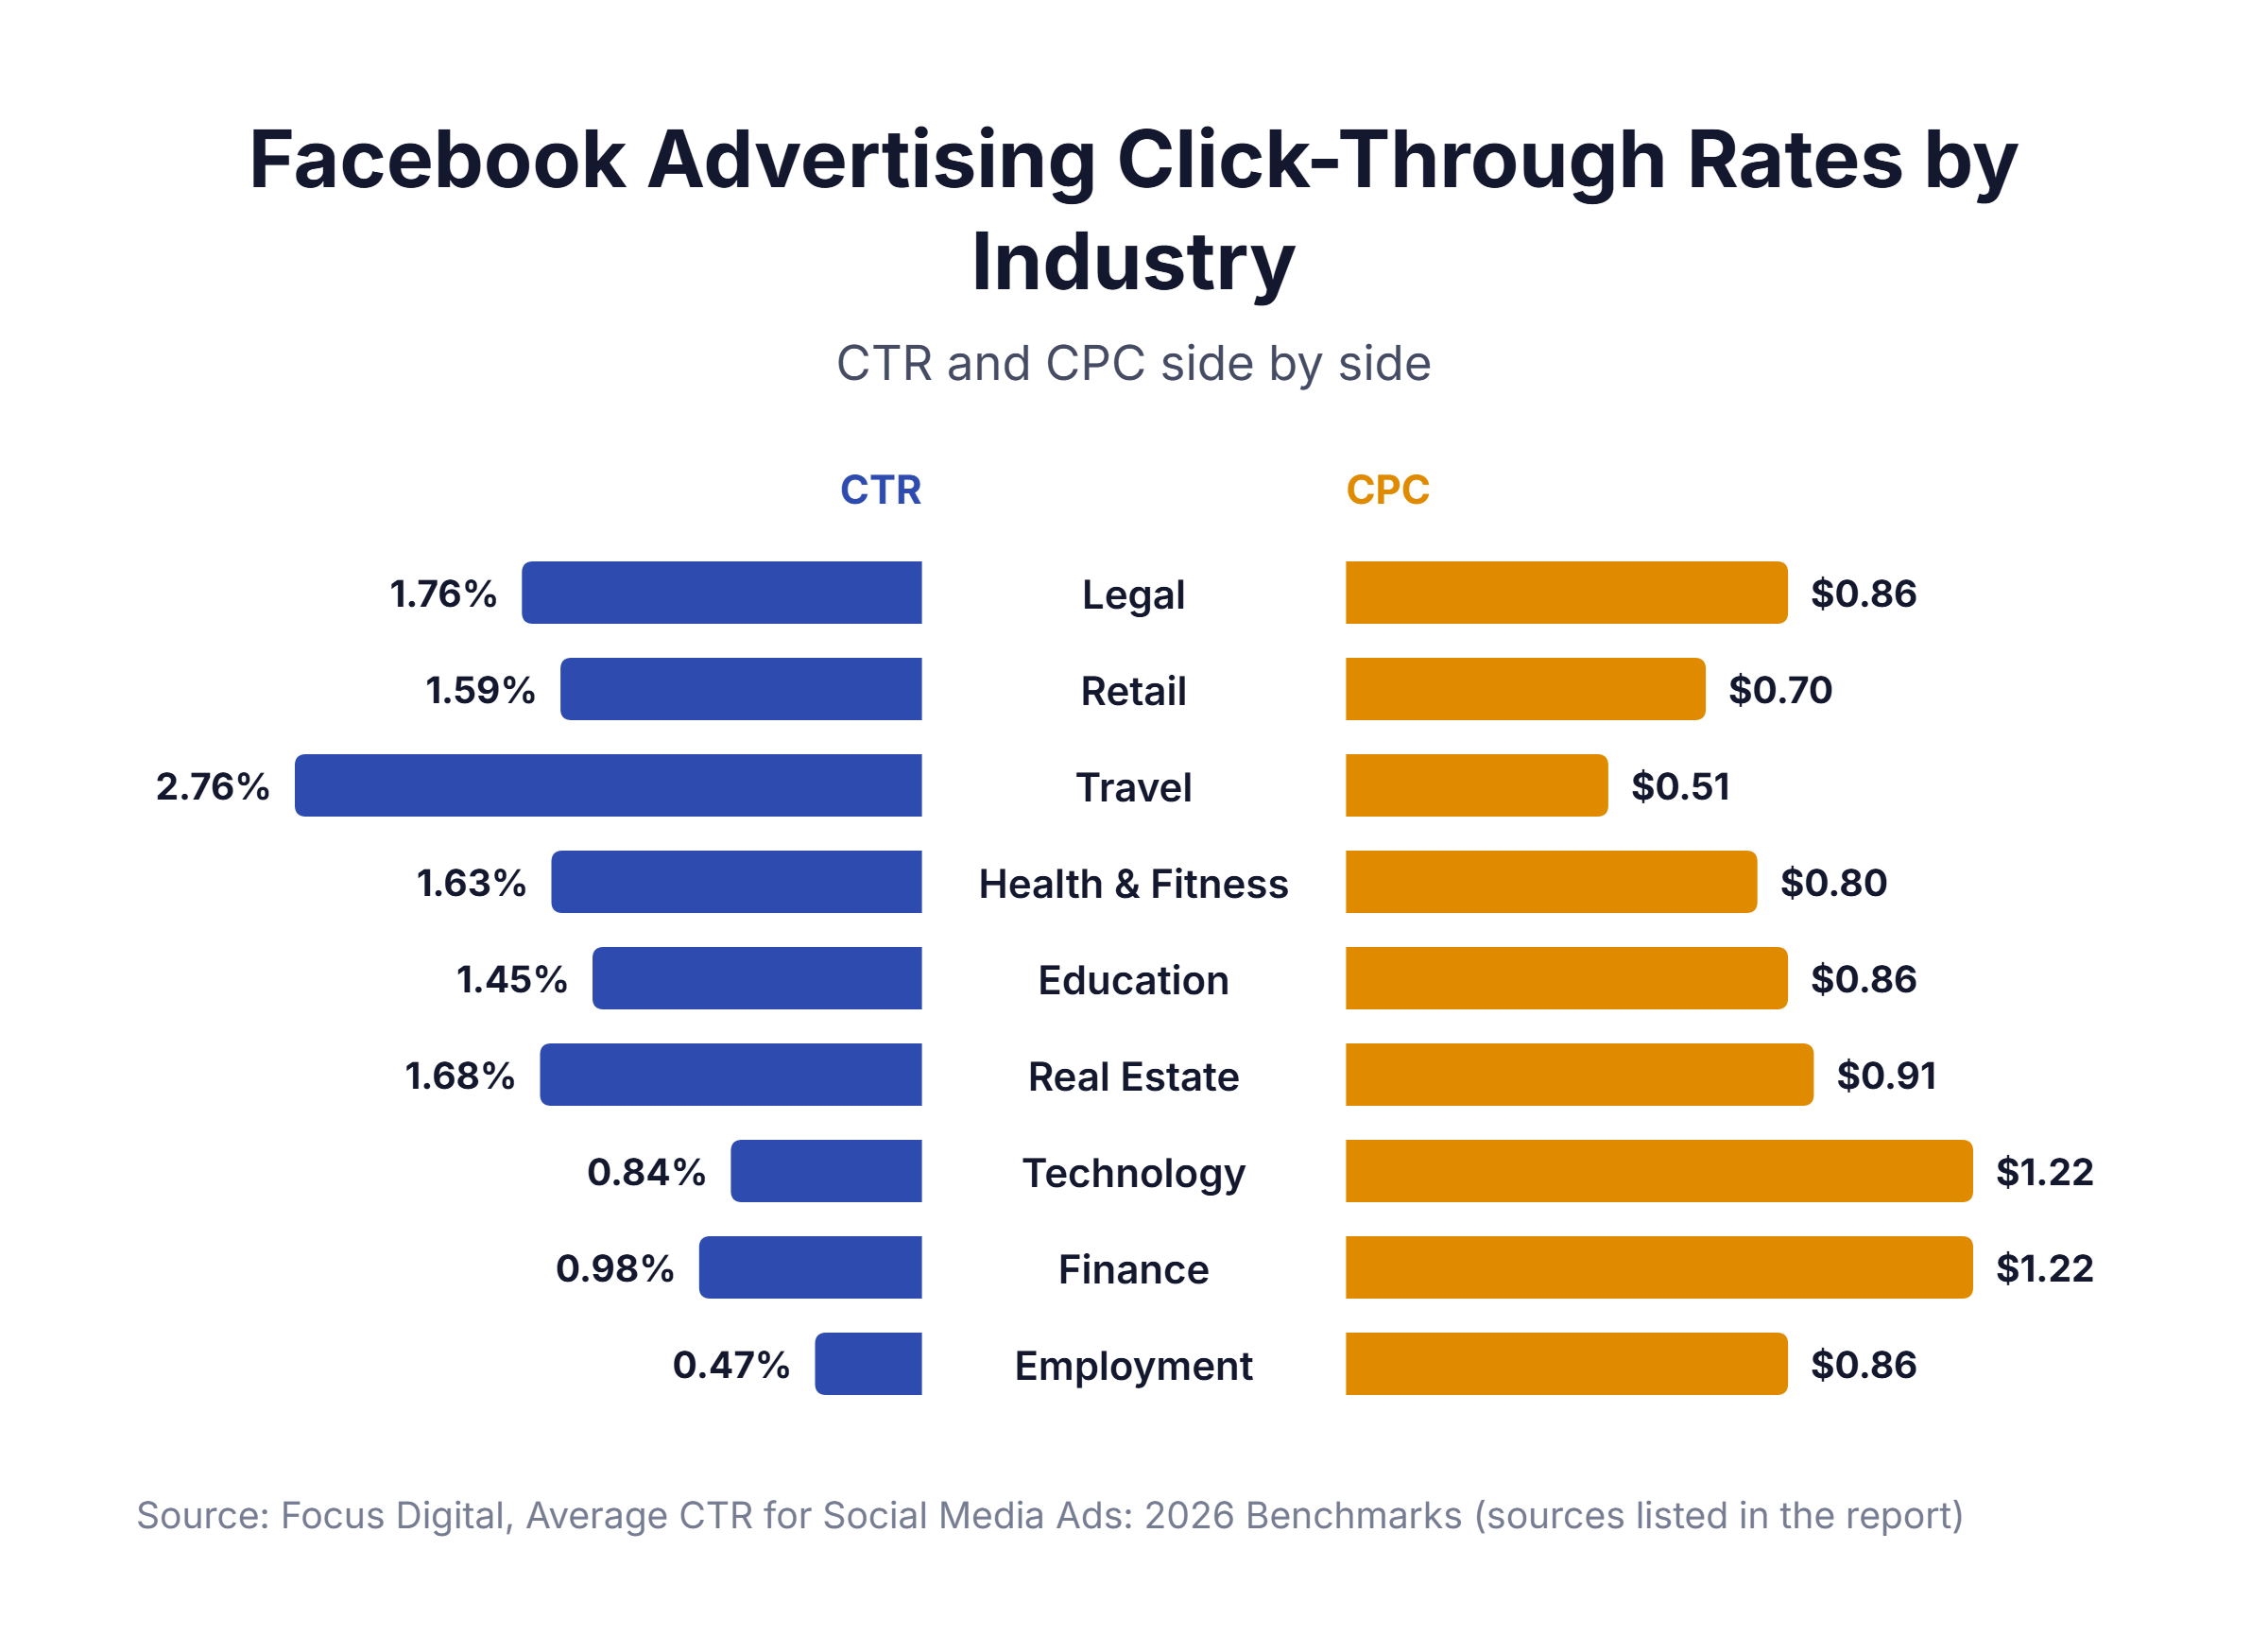
- Low CTR and high CPC travel together. On Facebook, finance pays the highest cost per click at $0.86 with the lowest CTR, while travel pays the lowest at $0.42.
- Legal is a fair test against Google Ads. Legal ads earn 1.77% CTR at $0.69 per click on Facebook, a benchmark law firms can use before shifting budget from search.
Average LinkedIn Ad CTR by Industry
LinkedIn shows wide performance differences across business categories, with retail unexpectedly earning the highest engagement among B2B-focused campaigns.
| Business Category | CTR | CPL | CVR |
|---|---|---|---|
| Retail | 0.80% | $89 | 1.60% |
| Transportation | 0.67% | $112 | 1.45% |
| Software & Technology | 0.44% | $127 | 1.22% |
| Hardware & Networking | 0.42% | $150 | 1.18% |
| Media & Communication | 0.41% | $98 | 1.35% |
| Manufacturing | 0.38% | $134 | 1.14% |
| Financial Services | 0.35% | $156 | 1.08% |
| Healthcare | 0.33% | $145 | 1.02% |
Key Research Findings:
- Format beats industry on LinkedIn. Thought leader ads posted from an employee’s profile earn a 2.68% median CTR, six times the 0.42% median for single image ads, while industries span only 0.33% to 0.80%.
- Consumer brands get the cheapest LinkedIn leads. Retail earns the highest CTR and the lowest cost per lead at $89, $67 less than financial services.
- Software companies can plan around 0.42% to 0.44%. B2B technology categories cluster in that narrow range, which makes it a dependable budgeting benchmark.
Average Instagram Ad CTR by Ad Format
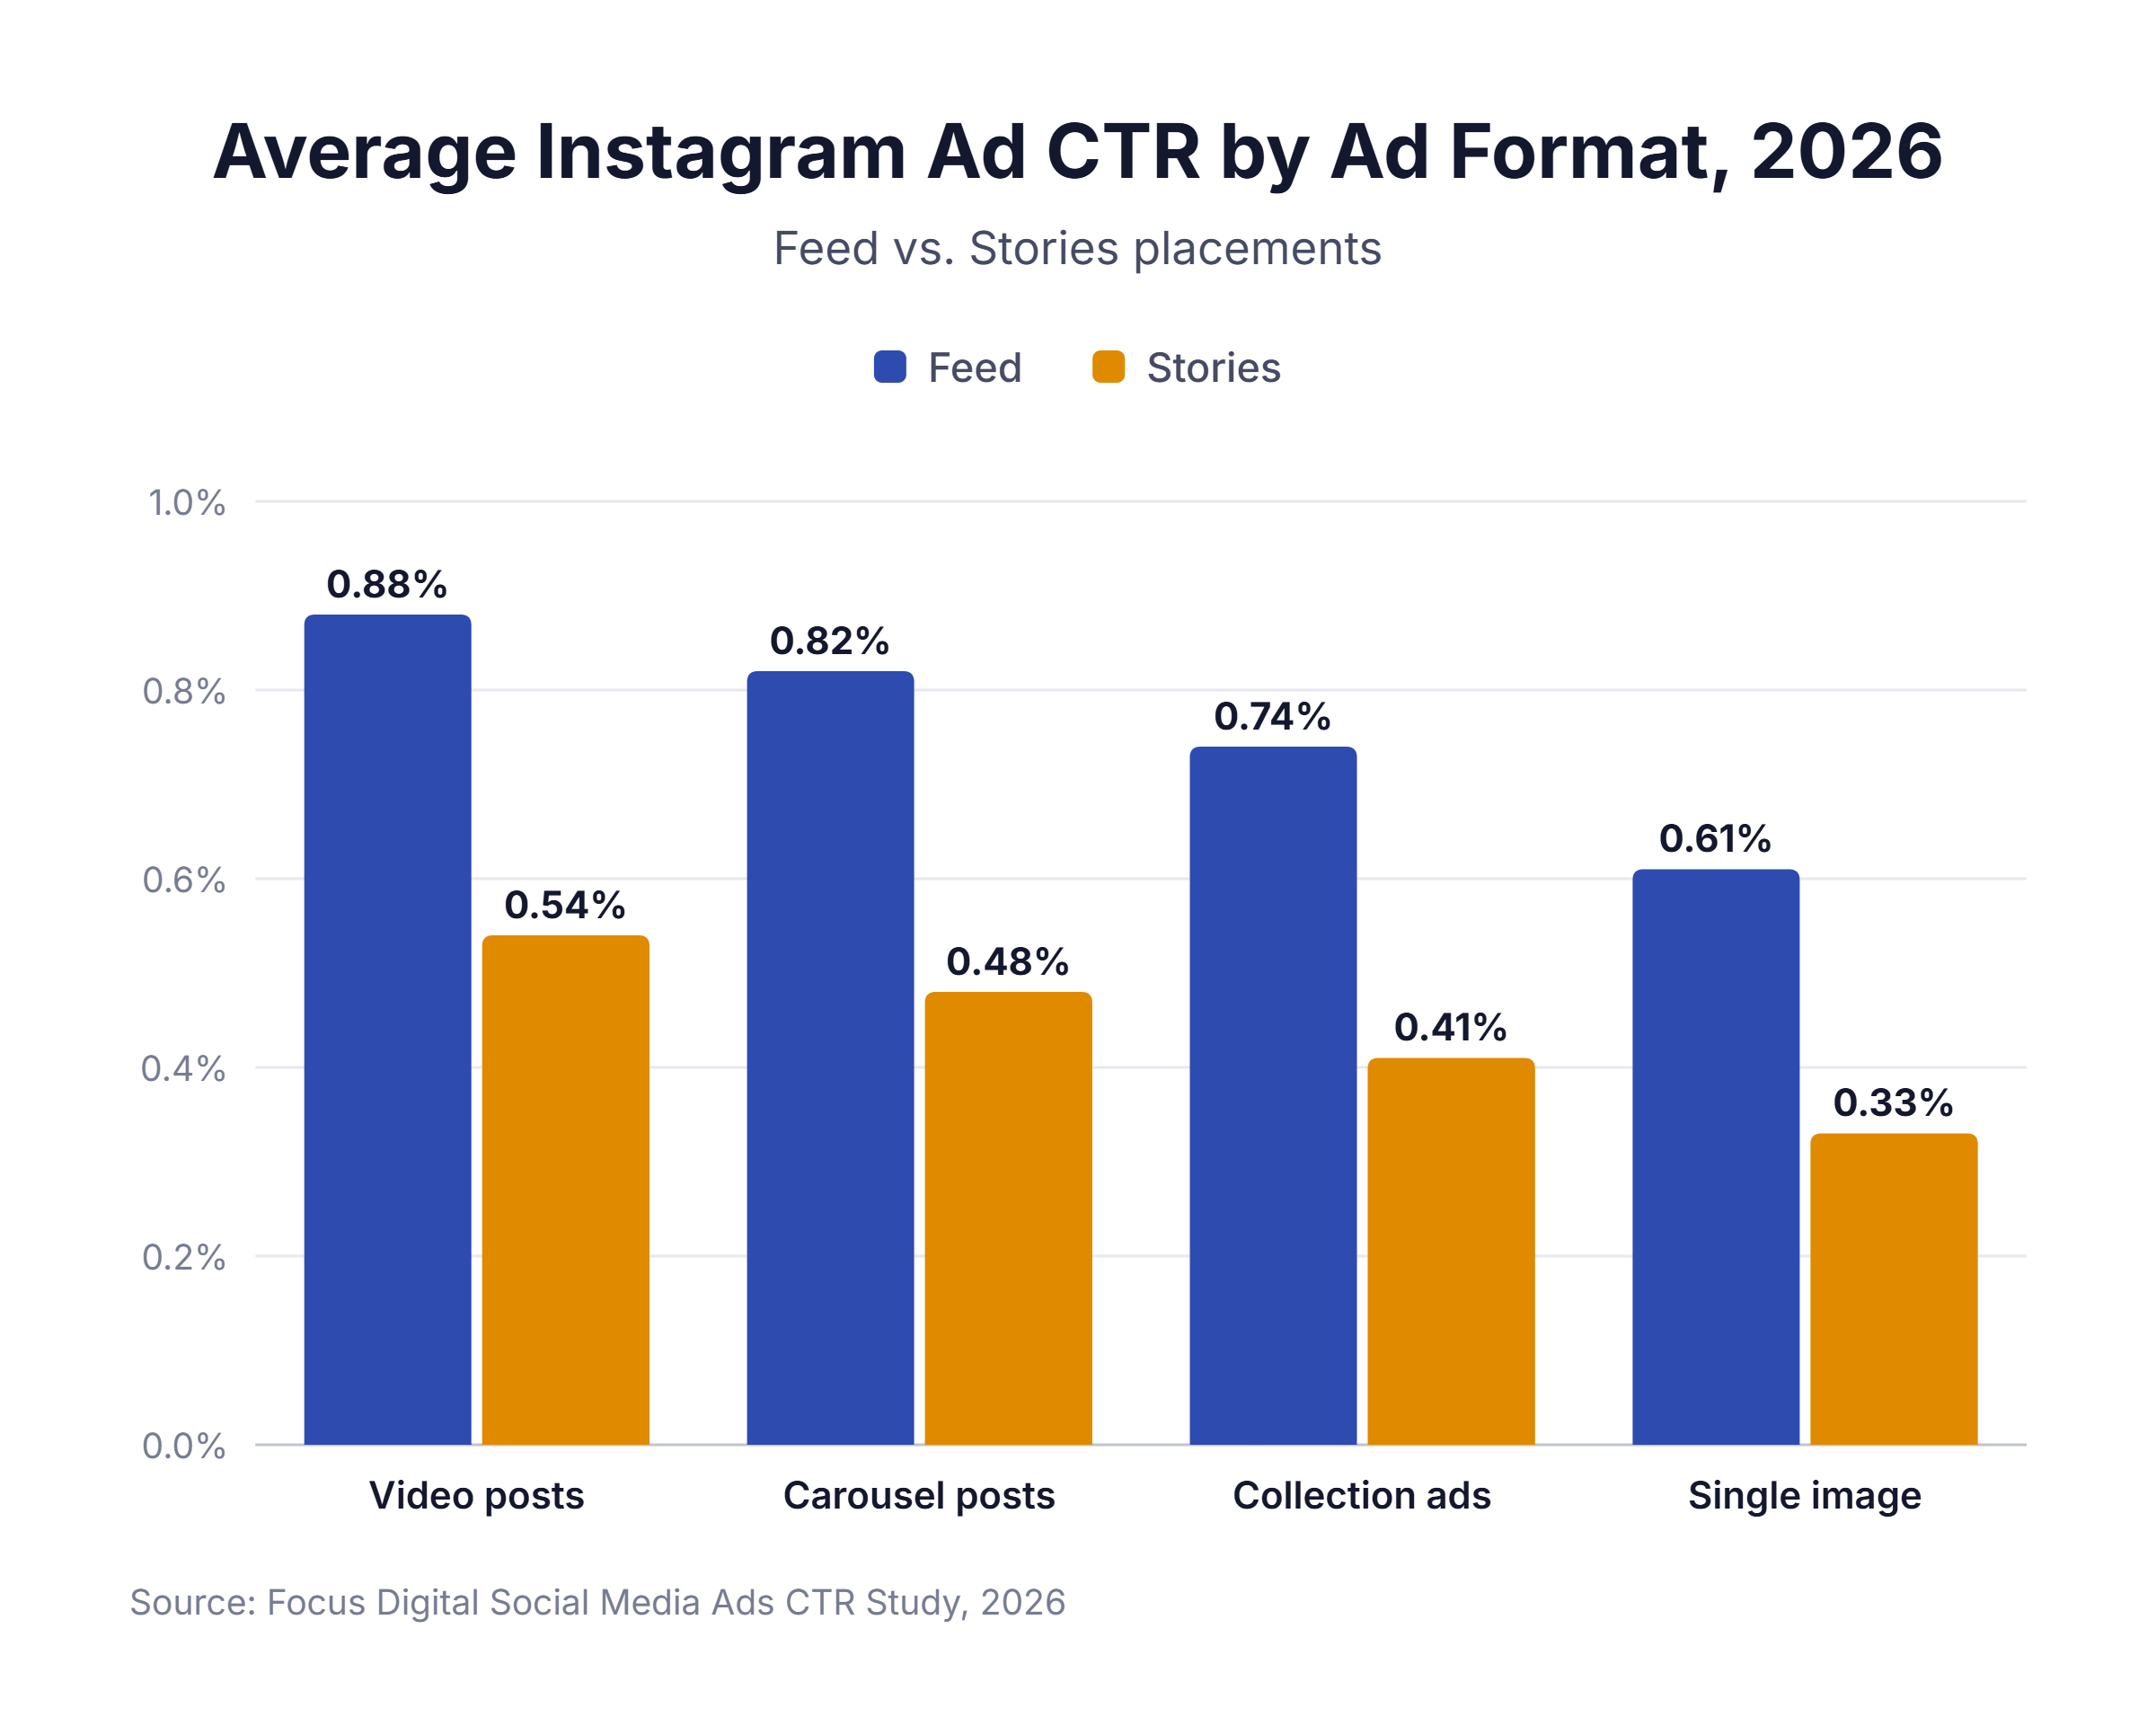
Video formats earn higher engagement than static images across Instagram’s ad placements, with CTR differences reaching 44.26% between content types.
| Format Type | Feed CTR | Stories CTR | CPC | CVR |
|---|---|---|---|---|
| Video Posts | 0.88% | 0.54% | $1.83 | 2.13% |
| Carousel Posts | 0.82% | 0.48% | $2.15 | 1.84% |
| Single Image | 0.61% | 0.33% | $3.35 | 1.41% |
| Collection Ads | 0.74% | 0.41% | $2.67 | 1.62% |
Key Research Findings:
- Video wins on clicks and cost. Feed video earns 0.88% CTR compared to 0.61% for single images, and each click costs $1.52 less.
- Formats that earn clicks also convert. Video converts 2.13% of clicks compared to 1.41% for single images, so a higher CTR on Instagram does not mean lower-quality traffic.
- Winning creative carries over to Stories. Stories CTR is lower for every format, and the format ranking stays the same, so a feed winner is the best first test in Stories.
Social Media Ad CTR on Mobile vs. Desktop
Mobile placements earn higher click-through rates than desktop on every major platform, with advantages ranging from 15.99% to 49.18%.
| Platform | Mobile CTR | Desktop CTR | Performance Lift | Mobile Traffic Share |
|---|---|---|---|---|
| 0.91% | 0.61% | +49.18% | 94.37% | |
| 0.68% | 0.51% | +33.33% | 98.12% | |
| 0.53% | 0.43% | +23.25% | 87.46% | |
| Twitter/X | 0.87% | 0.75% | +15.99% | 91.28% |
Key Research Findings:
- Mobile sets the average. Mobile carries 87.46% to 98.12% of social ad traffic, so each platform’s average CTR sits within a few hundredths of its mobile CTR.
- LinkedIn is the one platform where desktop earns its budget. LinkedIn has the largest desktop audience at 12.54% of traffic, and desktop CTR there trails mobile by only 0.10 points.
What Happens After the Click: Paid Social vs. Google Ads
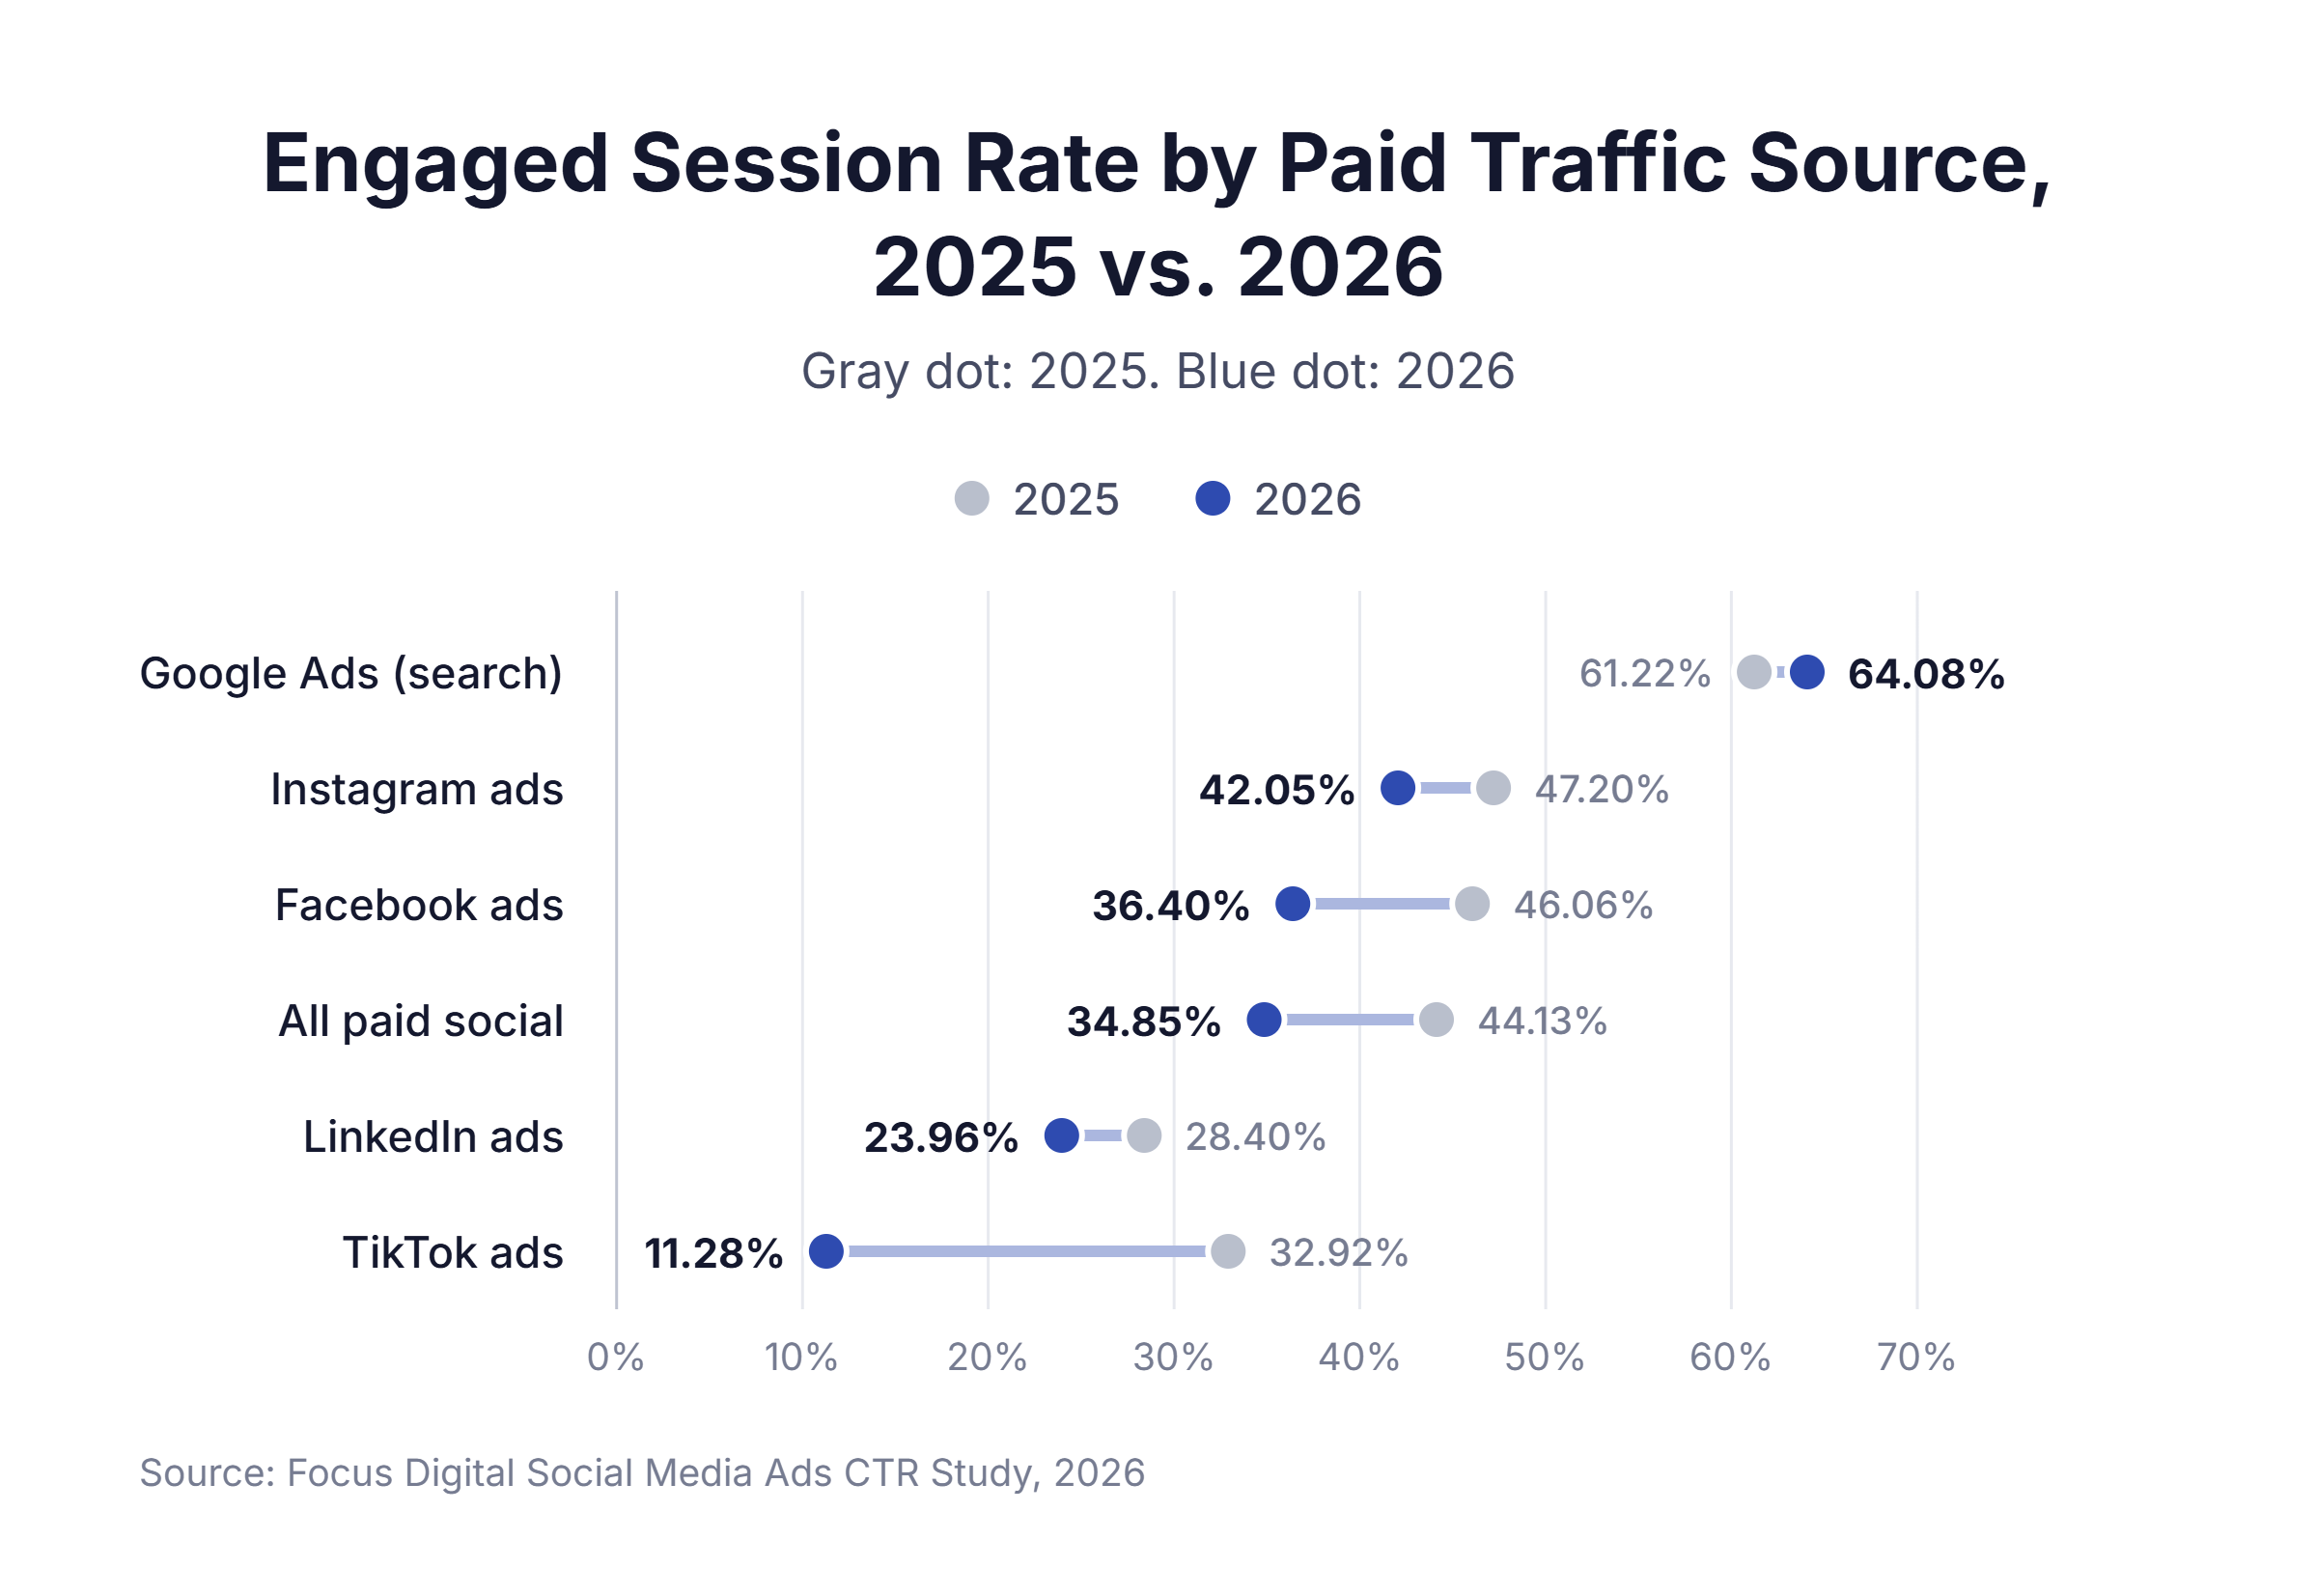
We tracked 16,184,583 paid social visits across 104 websites from November 2025 through October 2026 and compared them with Google Ads visits to the same sites.
| Traffic Source | Engaged Session Rate, 2026 | Engaged Session Rate, 2025 | Conversion Rate vs. Google Ads |
|---|---|---|---|
| Google Ads (search) | 64.08% | 61.22% | Baseline |
| Instagram ads | 42.05% | 47.20% | 6.05% of the Google Ads rate |
| Facebook ads | 36.40% | 46.06% | 17.69% of the Google Ads rate |
| LinkedIn ads | 23.96% | 28.40% | 15.85% of the Google Ads rate |
| TikTok ads | 11.28% | 32.92% | Under 1% of the Google Ads rate |
| All paid social | 34.85% | 44.13% | 19.23% of the Google Ads rate |
Key Research Findings:
- Five paid social visits equal one Google Ads visit. A paid social click converts at about one-fifth the rate of a Google Ads click on the same website.
- Search traffic improved while social traffic slipped. Google Ads engaged sessions rose 2.62 points year over year, while paid social fell 9.25 points on the same websites.
- TikTok traffic quality fell the furthest. TikTok’s engaged session rate dropped from 32.92% to 11.28%, the largest decline of any platform.
- Instagram visitors browse more and buy less. Instagram visitors engage more often than Facebook visitors (42.05% vs. 36.40%) but convert at about one-third of Facebook’s relative rate.
Our read on this: platforms now serve more ads in Reels, Stories, and other full-screen placements where accidental taps are common. CTR rises, and a larger share of those clicks come from people with no intent to act. We think advertisers should judge social campaigns on cost per engaged visit or cost per lead, with CTR as a creative test only.
Why Social Media Ads Get a Low CTR
Most low click-through rates trace back to a setup choice the advertiser controls. Each cause below shows the CTR it produces next to the stronger alternative.
| Cause of Low CTR | CTR With the Cause | CTR After the Fix |
|---|---|---|
| Awareness objective on a campaign meant to drive clicks | 0.98% | 1.93% (traffic objective) |
| Generic single image ads from a LinkedIn company page | 0.42% | 2.68% (thought leader ads) |
| A B2B offer on a consumer-first platform | 0.69% (finance on TikTok) | 1.53% (finance on X) |
| Stories placement for a click goal | 0.54% (Stories video) | 0.88% (feed video) |
| Desktop-heavy delivery on Facebook | 0.61% | 0.91% (mobile) |
| Static single image creative on Instagram | 0.61% | 0.88% (feed video) |
Key Research Findings:
- The objective sets the ceiling. Meta shows an awareness campaign to people unlikely to click, so creative changes cannot lift its CTR to traffic campaign levels.
- Most fixes cost nothing. Changing the objective, placement, or format uses the same budget and often the same creative assets.
How to Improve Social Media Ad CTR
Each change below raises click-through rate by the amount shown, measured from the CTR the advertiser had before the change.
| Do This | What It Fixes | Raises CTR by Up To |
|---|---|---|
| Run LinkedIn ads from an employee’s profile as thought leader ads | Low trust in company page posts | 538.09% |
| Pick the platform that fits your industry | B2B offers shown to consumer audiences | 121.73% |
| Use the traffic objective for any campaign meant to drive clicks | Meta showing ads to people unlikely to click | 96.93% |
| Run click campaigns in feed placements | Low click rates in Stories | 62.96% |
| Prioritize mobile placements on Facebook | Weaker desktop engagement | 49.18% |
| Switch Instagram feed ads from single images to video | Static creative that viewers scroll past | 44.26% |
| Use carousel ads when you have several products | Single images that show one product | 34.42% |
The gains overlap, so they do not add together. We think advertisers should check CTR against the engaged session rate after each change, since a higher CTR from accidental taps raises cost without adding prospects.
How These Figures Are Calculated
- Click-through rate (CTR) = link clicks ÷ impressions × 100
- Engaged session rate = engaged sessions ÷ sessions × 100, where an engaged session lasts longer than 10 seconds, includes a conversion, or views two or more pages
- Engaged session rate, 2025 = the same calculation for November 2024 through October 2025, limited to websites with paid traffic in both years
- Good (top 25%) and below average ranges = 1.5 times and 0.7 times each platform’s average CTR
- CTR lift from a change = (CTR after the change ÷ CTR before the change − 1) × 100, using the paired rates in the tables above
- Industry CTR on Instagram, TikTok, LinkedIn, and X = Facebook industry CTR × that platform’s average CTR ÷ Facebook’s average CTR, weighted by each industry’s published performance on the platform
- Conversion rate vs. Google Ads = a website’s paid social conversion rate ÷ the same website’s Google Ads conversion rate, reported as the median across websites
Requesting a Copy of This Report
If you’d like to request a PDF copy of this report or learn more about our agency, you can reach out here.
Sources
(10)
- Focus Digital Social Media Ads CTR Study, 2026. Platform, objective, industry, format, and device CTR compiled from published advertising benchmarks (listed below) for August 2025 through October 2026, with Focus Digital modeling to align periods and fill platform and industry combinations. Post-click data covers 16,184,583 paid social sessions across 104 websites from November 2025 through October 2026, compared with the prior 12 months on websites with data in both periods. Conversion comparisons use only websites with 1,000 or more Google Ads sessions and a Google Ads conversion rate between 0.3% and 25%.
- WordStream / LocalIQ, Facebook Advertising Benchmarks 2026 (1,377 traffic and 452 lead campaigns)
- PPC Land, Facebook lead costs hold at $27.39 as traffic clicks drop to $0.60 (September 2026)
- ZenABM, LinkedIn Ads Benchmarks 2026 (161,256 ads from 211 B2B companies)
- Lebesgue, TikTok Ads Benchmarks 2026
- Social Advertising Benchmarks for 2025, Brafton
- Social Media Benchmarks: 2025 Data + Tips, Hootsuite
- AdAmigo, Meta Ads Benchmarks 2026 by Objective and Placement (2025 objective CTRs)
- Fibbler, Facebook Ads Benchmarks 2026 (2026 objective CTRs)
- AdManage, What Is a Good CTR? 2026 Benchmarks (Snapchat, YouTube in-stream, and Snapchat click measurement change)