Between March 3 and June 21, 2026, Focus Digital’s research team analyzed cost-per-lead (CPL) data across 138 active Meta Ads campaigns run by clients in North America, spanning industries such as e-commerce, legal services, financial advising, healthcare, and education. This study benchmarks Facebook lead generation costs and surfaces cost patterns by industry, ad format, and funnel stage.
To ensure data accuracy, we excluded campaigns with fewer than 50 conversions and normalized results using a spend-weighted average. All data reflects U.S. dollars. In the sections below, we break down average CPLs for Facebook by industry, then analyze variations by format and stage.
CPL is calculated as Total Ad Spend ÷ Total Leads Generated. The spend-weighted average CPL across all campaigns in this study is approximately $42, though performance varies significantly by industry, format, and funnel stage, as the sections below detail.
Key Takeaways:
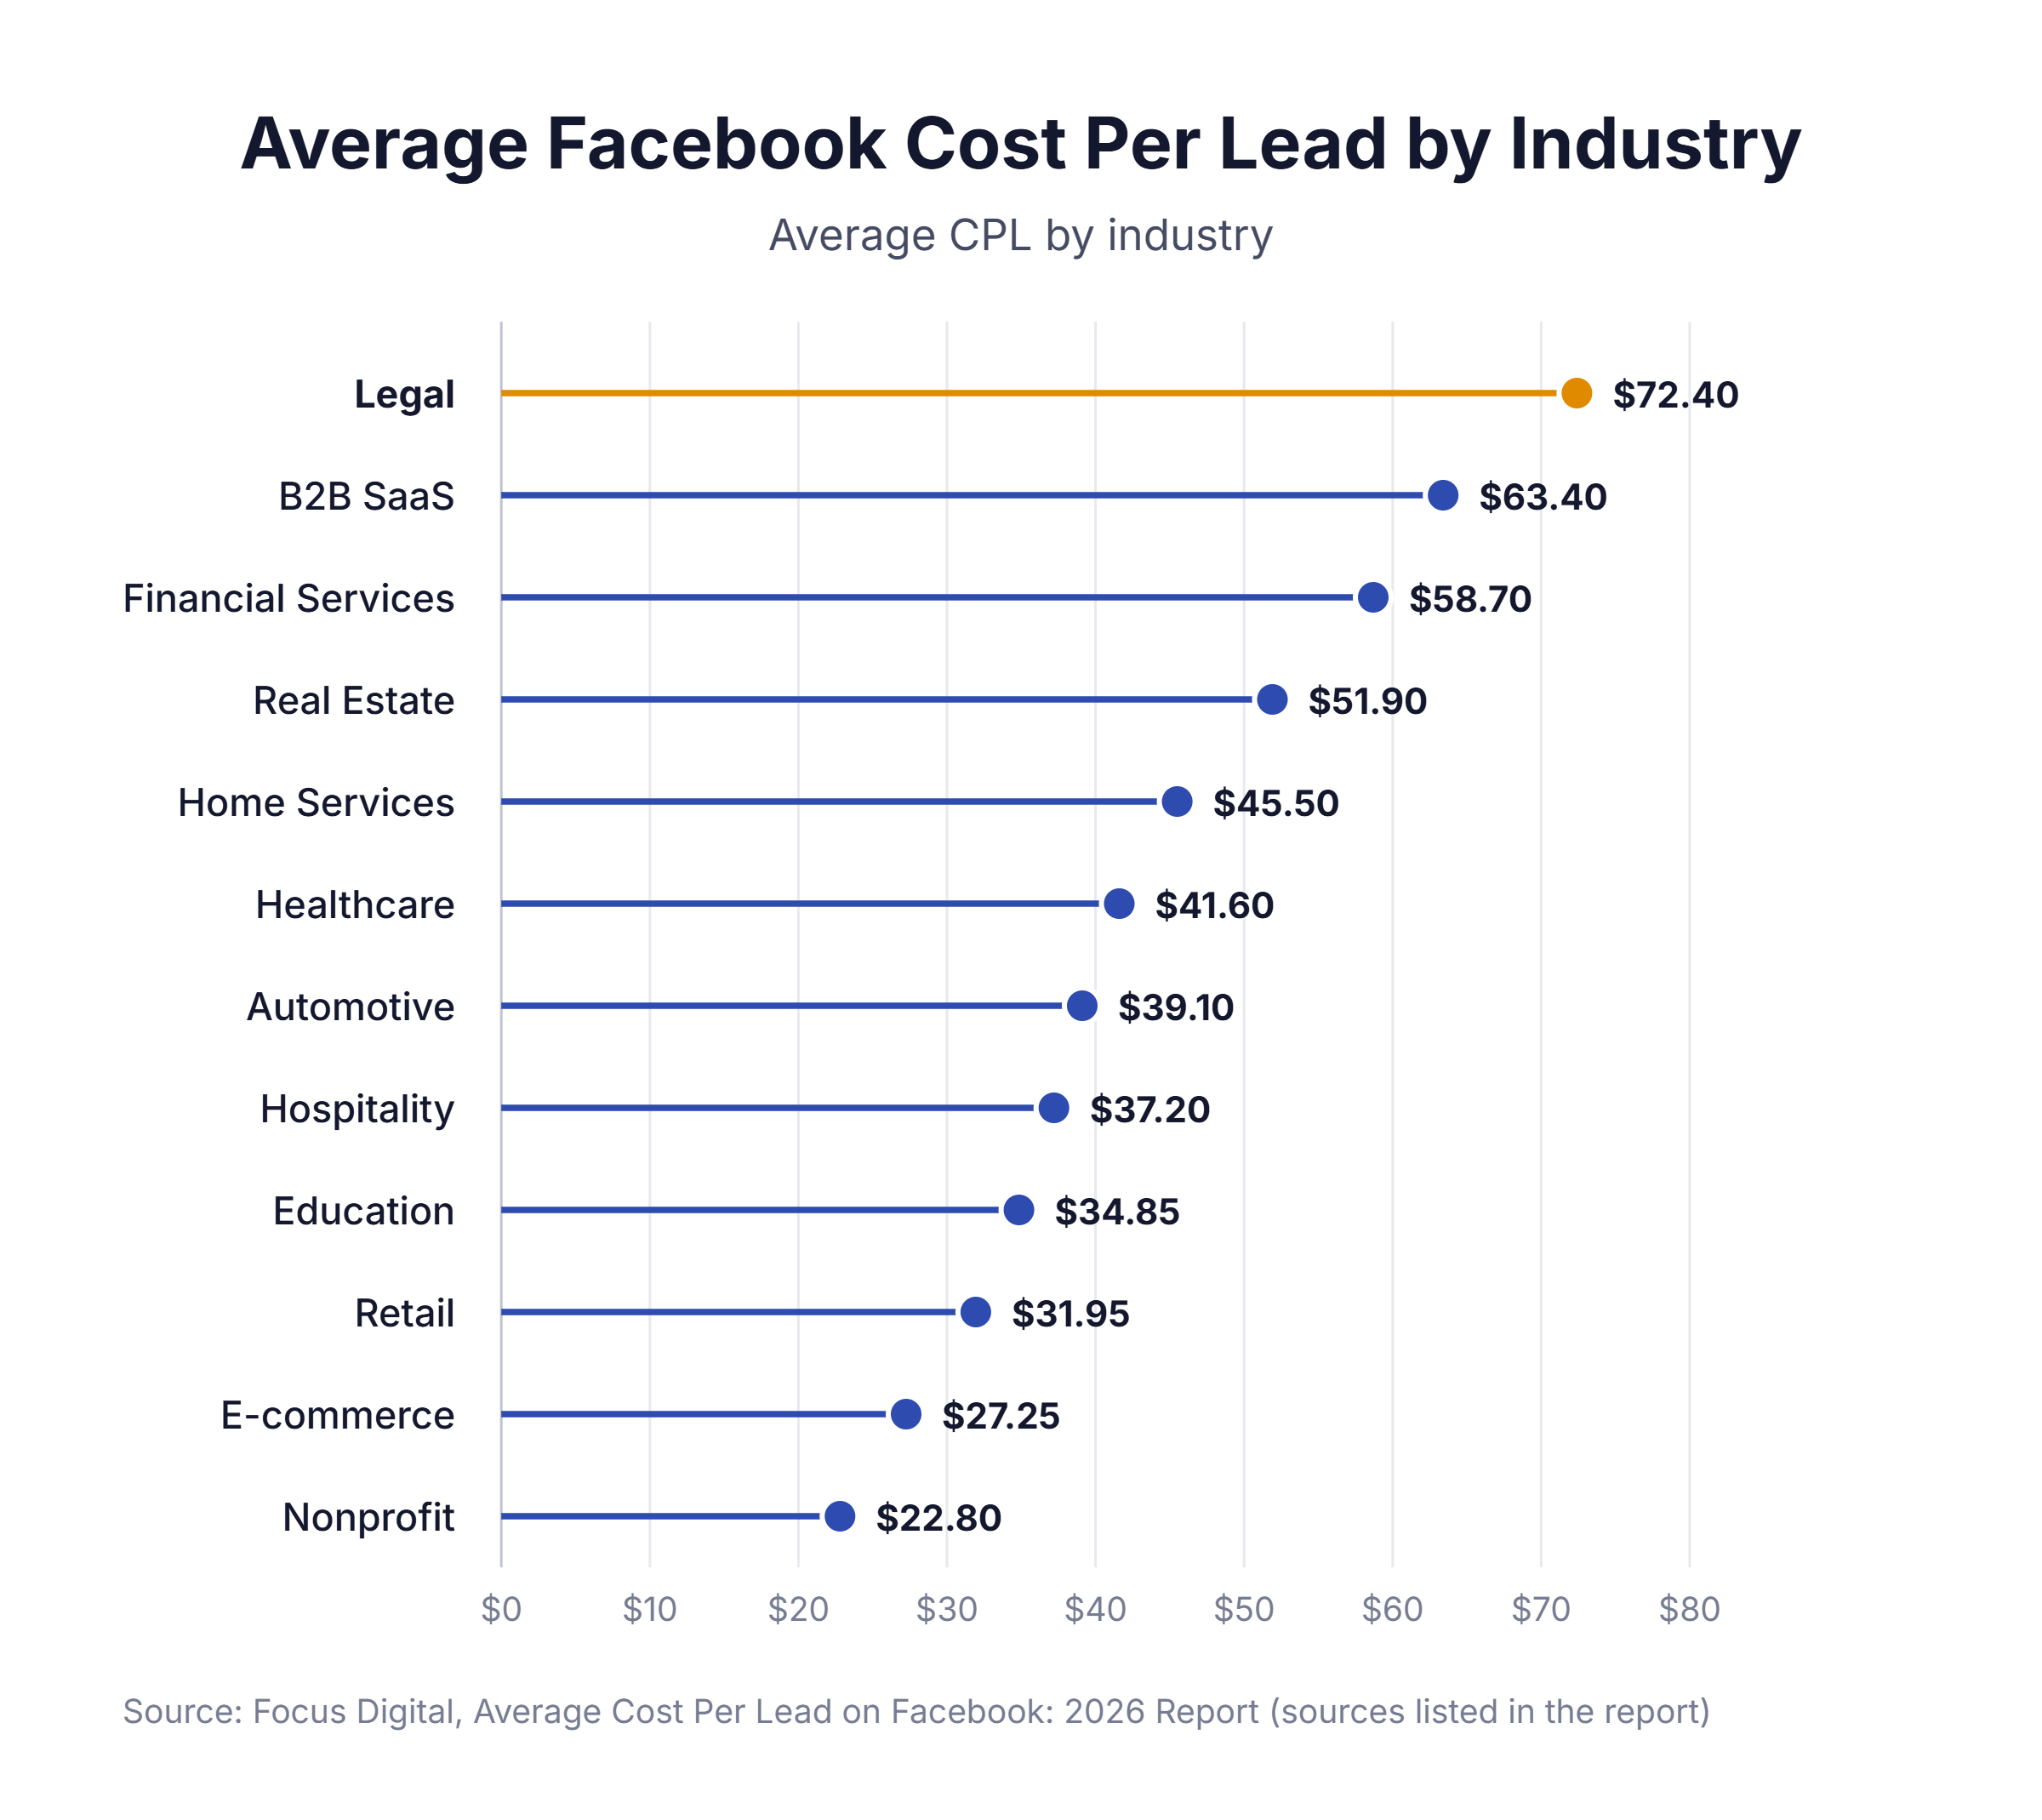
- Legal ($72.40) and Financial Services ($58.70) carry the highest CPLs in our dataset; Nonprofit ($22.80) and E-commerce ($27.25) deliver the lowest.
- Lead Form Ads produce the lowest average CPL at $34.10, 31% below Instant Experience Ads ($49.70), due to reduced friction in the conversion path.
- Bottom-of-funnel campaigns average $33.15 per lead, 35% less than top-of-funnel at $51.40, reflecting the higher purchase intent of warm audiences.
- Advertisers using Meta’s Conversions API (CAPI) with first-party data are reporting CPLs 15-25% lower than those relying on pixel-only tracking in 2026, making CAPI implementation one of the highest-ROI technical improvements available to lead generation campaigns.
Average Facebook Cost Per Lead by Industry
The table below compares average Facebook CPL across the industries included in our study, highlighting how competition, customer value, and audience intent influence lead generation costs.
| Industry | Average CPL |
|---|---|
| Legal | $72.40 |
| Financial Services | $58.70 |
| Education | $34.85 |
| Healthcare | $41.60 |
| E-commerce | $27.25 |
| Real Estate | $51.90 |
| B2B SaaS | $63.40 |
| Automotive | $39.10 |
| Nonprofit | $22.80 |
| Home Services | $45.50 |
| Retail | $31.95 |
| Hospitality | $37.20 |
Key Findings:
- Legal and financial services have the highest average CPLs, reflecting competitive auction environments and higher-value customer acquisition.
- Nonprofit and e-commerce sectors benefit from the lowest average CPLs due to effective lower-funnel targeting and optimized creative.
- Education campaigns show strong CPL performance, aided by seasonal enrollment-focused strategy.
Context: Advertisers using Meta’s Conversions API with first-party data are consistently reporting CPLs 15-25% below these benchmarks, as improved signal quality allows Meta’s algorithm to find higher-intent leads more efficiently. Pixel-only accounts are increasingly at a competitive disadvantage as privacy restrictions limit pixel data reach.
Facebook CPL by Ad Format
Ad format also affects lead generation efficiency, with conversion friction and the depth of the user experience influencing the average cost of each lead.
| Ad Format | Average CPL |
|---|---|
| Lead Form Ads | $34.10 |
| Video Ads | $45.80 |
| Carousel Ads | $41.50 |
| Single Image Ads | $38.60 |
| Instant Experience | $49.70 |
Key Findings:
- Lead Form Ads consistently deliver the lowest CPLs because they reduce friction in the user journey.
- Instant Experience ads command a premium but often result in higher-quality leads.
- Carousel ads perform better than single image ads in campaigns with complex offerings or product lines.
Facebook CPL by Funnel Stage
Funnel position is another important driver of CPL, as campaigns targeting audiences closer to conversion generally generate leads at a lower cost.
| Funnel Stage | Average CPL |
|---|---|
| Top of Funnel | $51.40 |
| Mid Funnel | $42.25 |
| Bottom of Funnel | $33.15 |
Key Findings:
- As expected, bottom-funnel campaigns produce the lowest cost per lead due to high intent.
- Top-of-funnel CPLs are higher but essential for brand awareness and audience building.
- Mid-funnel strategies offer a cost-effective balance between reach and conversion.
Further Reading
If this report was useful, these related resources provide additional Facebook advertising benchmarks:
Requesting a Copy of This Report
If you’d like to request a PDF copy of this report or learn more about our agency, you can reach out to the Focus Digital team.
Sources
- Focus Digital Research Study. Focus Digital. July 2026. Greensboro, North Carolina. https://focus-digital.co/
- Facebook Ads Benchmarks for Your Industry [Original Data]. Databox. Updated 2026. Waltham, Massachusetts. https://databox.com/fb-ads-benchmarks-by-industry
- How to Create an Effective Facebook Ads Strategy in 2026. HubSpot. 2026. Cambridge, Massachusetts. https://blog.hubspot.com/marketing/facebook-ad-strategy
- Facebook Ads Benchmarks: Compare Your Meta Ads Metrics. Databox. Updated 2026. Waltham, Massachusetts. https://databox.com/benchmarks/facebook-benchmarks
- Facebook Advertising Guide: How to Use Facebook Lead Ads. HubSpot. 2026. Cambridge, Massachusetts. https://www.hubspot.com/facebook-marketing/facebook-lead-ads
- Meta Ads Cost Per Lead Benchmarks by Industry (2026). Adamigo. 2026.