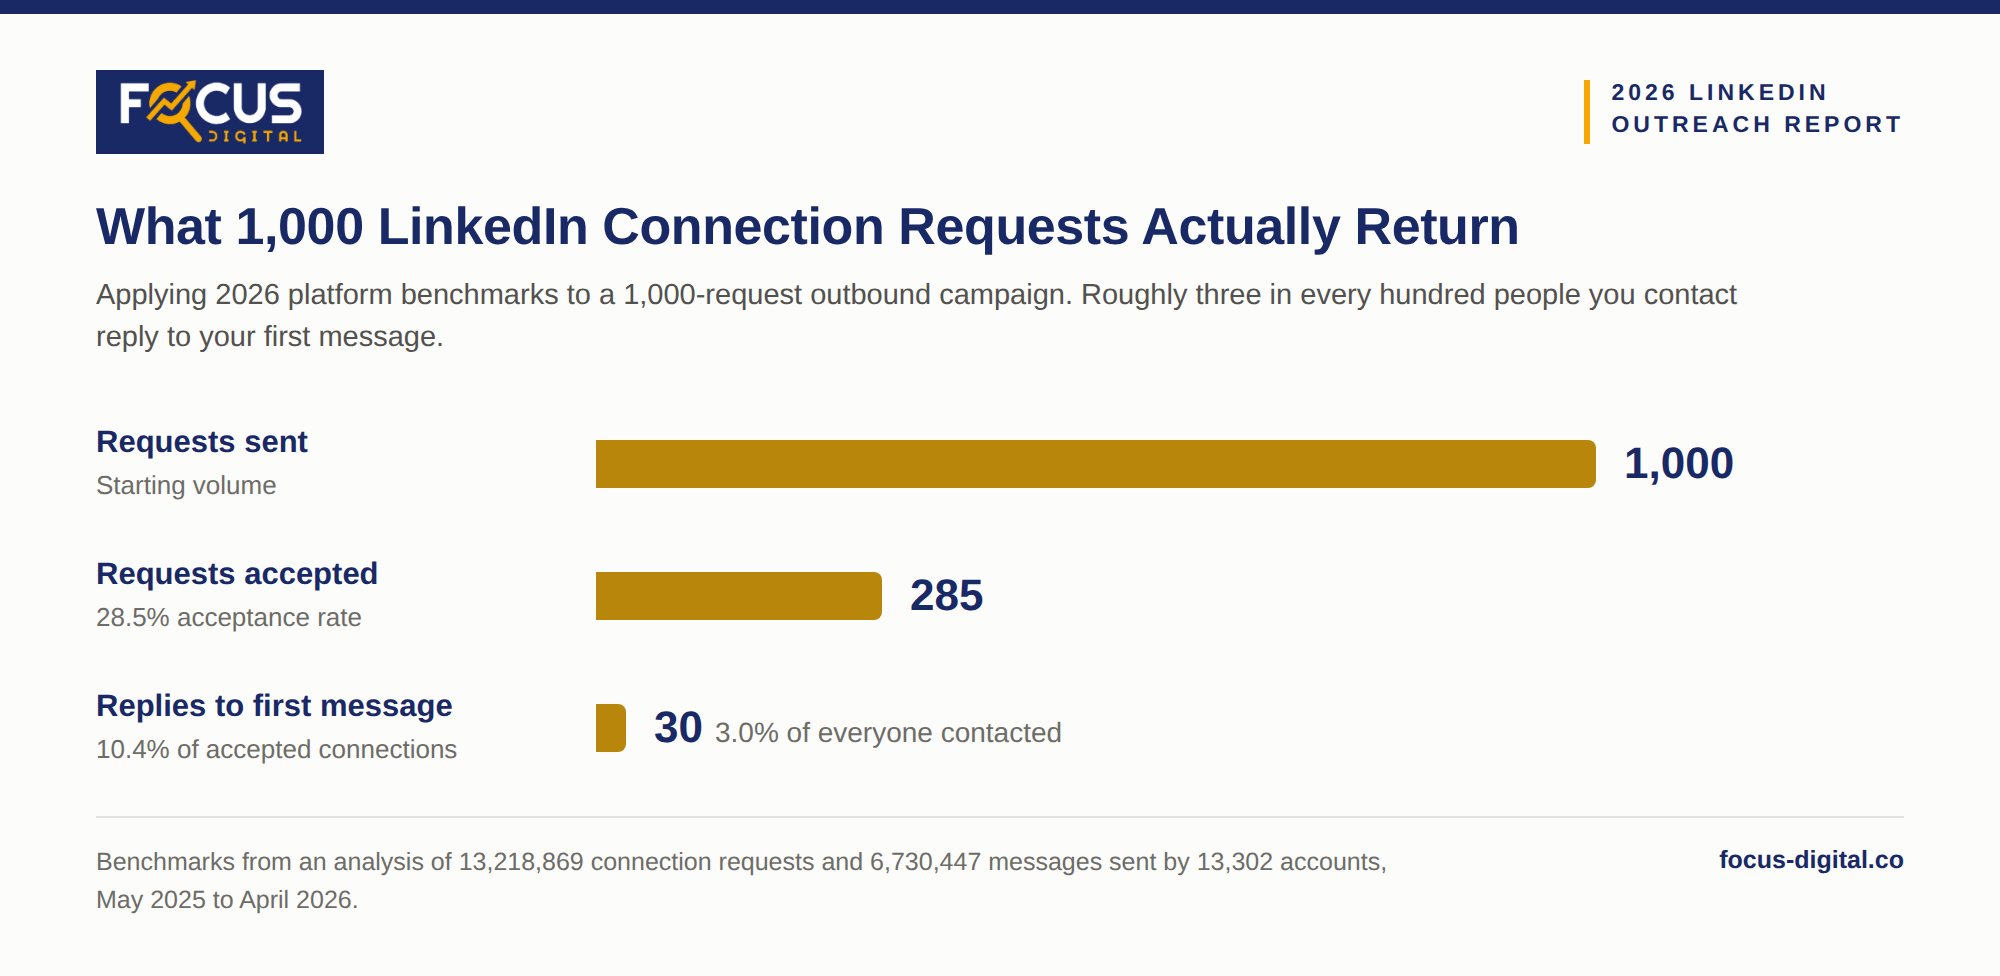
LinkedIn connection requests are accepted 28.5% of the time across B2B outbound, and industry moves that figure from 17.5% in consumer electronics up to 40.1% in broadcast media. InMail replies land between 10% and 25%, while a first message to a newly accepted connection draws 10.4%. Our research team collected every published LinkedIn outreach dataset, noting its sample and method, then discarded uncited percentages circulating across sales blogs. The evidence below covers 13 million connection requests plus 165,000 candidates contacted on two channels at once.
Key Takeaways
- Connection requests average 28.5% acceptance across 13.2 million sends, and the first message to that new connection replies at 10.4%.
- Industry swings acceptance by 23 percentage points, from 17.5% in consumer electronics to 40.1% in broadcast media.
- LinkedIn outperforms matched email 3.4 times over, replying at 16.6% against 4.4% among the same 165,000 recipients.
- LinkedIn strips InMail privileges from recruiters who fall below a 13% response rate on 100 or more sends inside a 14-day window.
LinkedIn Outreach Benchmarks at Every Step
Acceptance measures targeting while reply rate measures the message, so teams judging the motion by one number misdiagnose where prospects drop out. The table below establishes the 2026 baseline.| Outreach Step | 2026 Benchmark | Sample Behind the Figure |
|---|---|---|
| Connection request acceptance | 28.5% | 13,218,869 requests |
| Reply to the note attached to a request | 3.0% | 13.2 million requests |
| Reply to a message after acceptance | 10.4% | 6,730,447 messages |
| InMail response, typical range | 10% to 25% | LinkedIn guidance |
| InMail response, Recruiter policy floor | 13% | 100+ sends per 14 days |
| Cold email reply, same recipients | 4.4% | 165,000+ candidates |
- Acceptance runs three to four times higher than reply rate at every tier, so a healthy connection number says little about whether the messaging works.
- Replies to connection notes fell from 3.5% to 2.2% in twelve months while acceptance held near 29%, so recipients now accept requests they never intend to answer.
Connection Acceptance and Reply Rate by Industry
Industry predicts acceptance better than any firmographic split because it captures how much cold outreach a buyer already absorbs each week, which lifts civil engineering and broadcast media to the top. Our analysis below ranks verticals across the 13.2 million-request dataset.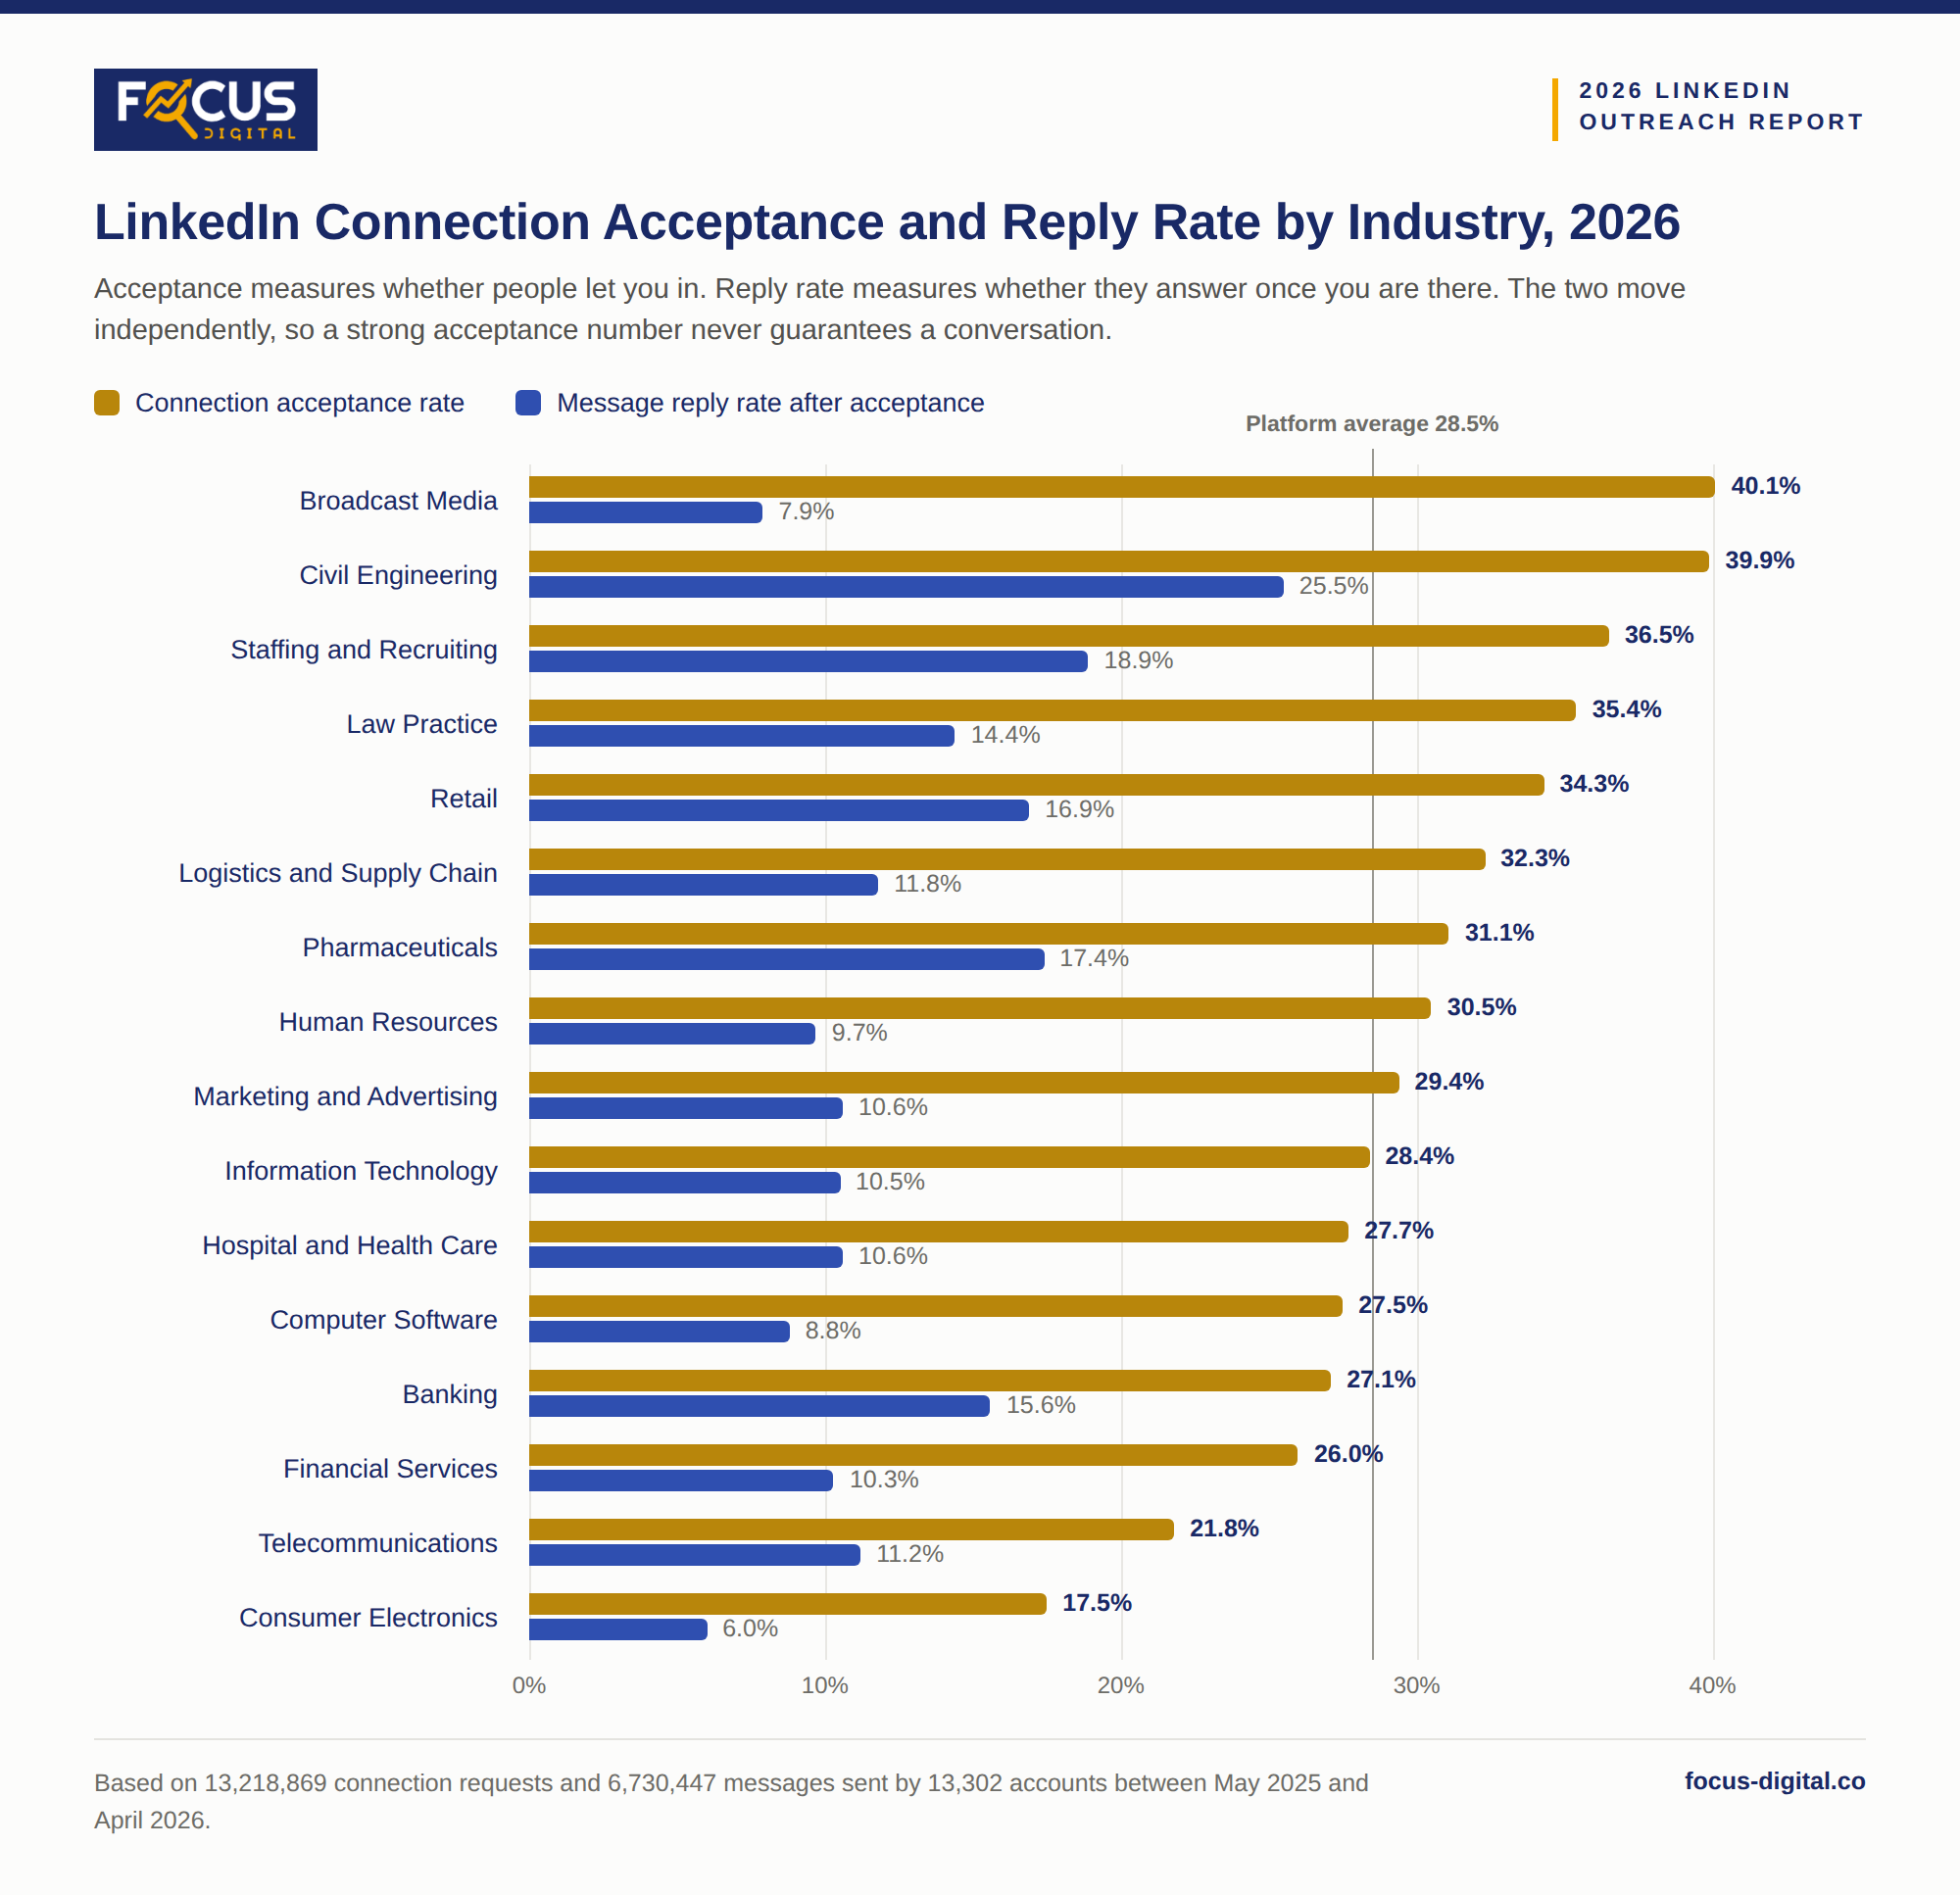 Key Insights:
- Computer software absorbed 1.8 million requests and returned a below-average 27.5% acceptance, which prices the cost of crowding into a saturated vertical.
- Acceptance and reply move independently, and banking proves it by accepting at a modest 27.1% while replying at 15.6%.
InMail Response Rate by Recipient Industry and Function
InMail reaches people outside a network, so its response rate depends on who opens it more than on who sends it. LinkedIn publishes comparisons against the global average, and campaign reporting fills the rest. Our data indicates the following spread.| Recipient Group | InMail Response Performance |
|---|---|
| Oil, gas and mining workers | 24% above global average |
| Utilities workers | 17% above global average |
| Quality assurance function | 16% above global average |
| Human resources function | 15% above global average |
| HR and talent acquisition recipients | 12.08% |
| C-level recipients | 6.98% |
| Sales and marketing recipients | 6.32% |
| Recipients who follow the sender’s company | 81% more likely to respond |
- Sales and marketing buyers answer at 6.32%, half the 12.08% HR recipients return, because those inboxes carry the platform’s heaviest cold-outreach load.
- A company follower answers 81% more often than a stranger, turning page growth into a measurable outbound asset.
What Moves the Number
Message construction changes outcomes more than send timing ever will, and length carries the clearest signal in LinkedIn’s reporting. The table below models each lever against its baseline.| Lever | Documented Effect |
|---|---|
| InMail under 400 characters | 22% above average response |
| InMail over 1,200 characters | 11% below average response |
| Personalized connection note | 35% to 55% acceptance |
| Generic or blank note | 15% to 25% acceptance |
| Acceptances arriving within 24 hours | 63% of all acceptances |
- A 400-character InMail outperforms a 1,200-character one by 33 percentage points of relative response, the largest documented lift available for no cost.
- Personalization results conflict sharply, since one 16,492-invitation study found blank requests beating noted ones, so every team should split-test its own note.
Further Reading
- Average Cold Call Conversion Rate by Industry 2026
- B2B Cold Email Open Rates by Industry, Subject Line
- Average Sales Call Conversion Rate by Industry: 2026 Report
- Average Cost Per Qualified Lead: 2026 Report
- Average Sales Cycle Length by Industry: 2026
- Direct-Mail Response Rates by Industry in 2026
Sources
- LinkedIn Outreach Benchmarks 2026: 13.2M Data Points
- LinkedIn Connection Request Acceptance Rates
- Email vs LinkedIn vs SMS Recruiting: 2026 Reply Rates
- The Workers and Industries with the Highest InMail Response Rates
- InMail Improvement Period in Recruiter
- LinkedIn Connection Acceptance Rate Benchmarks 2026
- LinkedIn Response Rate Benchmarks: What’s a Good Reply Rate?
- How to Increase LinkedIn Connection Acceptance Rate
- LinkedIn InMail: The Complete Guide for 2026