Our team conducted a comprehensive study of the average sales cycle length by industry, with further segmentation based on the sales cycle stage. We have also presented information for the average sales cycle length based on the company size of the prospect, the sales channel, and the complexity of the product.
You’ll notice that we have left product prices off our list of analyses. While we examined this metric, we concluded that there was insufficient data to segment based on price point, as price point does not directly influence the sales cycle length, but rather the percentage of price to the prospect’s revenue.
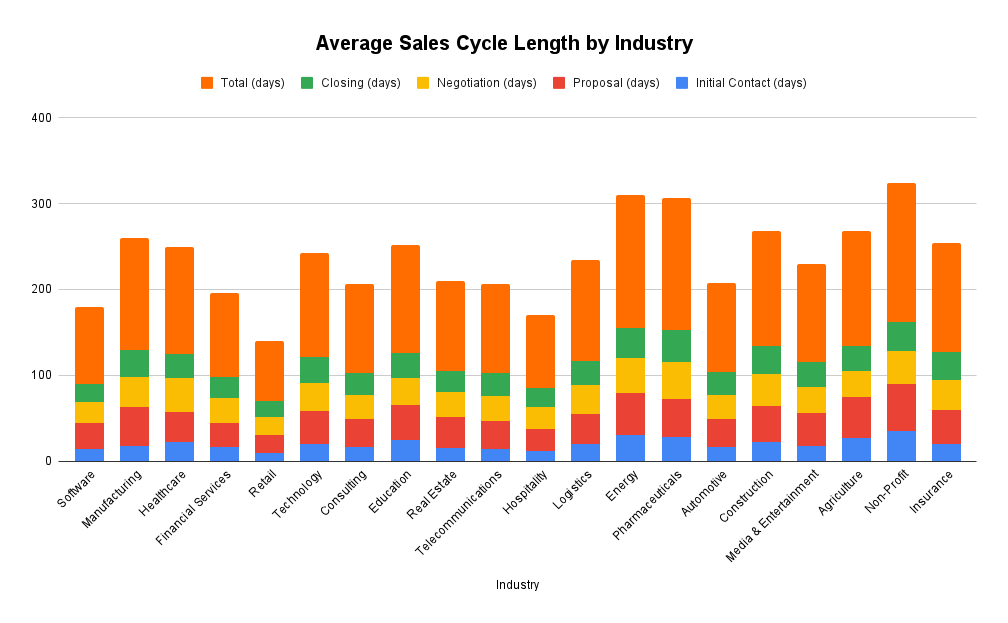
Average Sales Cycle Length by Industry & Pipeline Stage
We’ve compiled the average sales cycle length by industry, further broken down by pipeline stage to help sales teams set realistic expectations and spot potential bottlenecks.
The Average Sales Cycle Length by Industry & Pipeline Stage – 2025
| Industry | Initial Contact (days) | Proposal (days) | Negotiation (days) | Closing (days) | Total (days) |
|---|---|---|---|---|---|
| Software | 14 | 30 | 25 | 21 | 90 |
| Manufacturing | 18 | 45 | 35 | 32 | 130 |
| Healthcare | 22 | 35 | 40 | 28 | 125 |
| Financial Services | 16 | 28 | 30 | 24 | 98 |
| Retail | 10 | 20 | 22 | 18 | 70 |
| Technology | 20 | 38 | 33 | 30 | 121 |
| Consulting | 17 | 32 | 28 | 26 | 103 |
| Education | 25 | 40 | 32 | 29 | 126 |
| Real Estate | 15 | 36 | 30 | 24 | 105 |
| Telecommunications | 14 | 33 | 29 | 27 | 103 |
| Hospitality | 12 | 25 | 26 | 22 | 85 |
| Logistics | 20 | 35 | 34 | 28 | 117 |
| Energy | 30 | 50 | 40 | 35 | 155 |
| Pharmaceuticals | 28 | 45 | 42 | 38 | 153 |
| Automotive | 16 | 33 | 28 | 27 | 104 |
| Construction | 22 | 42 | 37 | 33 | 134 |
| Media & Entertainment | 18 | 38 | 31 | 28 | 115 |
| Agriculture | 27 | 48 | 30 | 29 | 134 |
| Non-Profit | 35 | 55 | 38 | 34 | 162 |
| Insurance | 20 | 40 | 35 | 32 | 127 |
Average Sales Cycle Length by Company Size
Below, you’ll find sales cycle durations organized by prospect company size, giving industry-agnostic insights for targeting different market segments.
The Average Sales Cycle Length by Company Size – 2025
| Prospect Company Size | Initial Contact (days) | Proposal (days) | Negotiation (days) | Closing (days) | Total (days) |
|---|---|---|---|---|---|
| 1-10 Employees | 7 | 14 | 10 | 7 | 38 |
| 11-50 Employees | 10 | 20 | 15 | 12 | 57 |
| 51-200 Employees | 14 | 25 | 20 | 18 | 77 |
| 201-500 Employees | 18 | 30 | 25 | 22 | 95 |
| 501-1000 Employees | 22 | 35 | 30 | 28 | 115 |
| 1001-5000 Employees | 28 | 40 | 35 | 32 | 135 |
| 5001-10,000 Employees | 35 | 45 | 40 | 38 | 158 |
| 10,001+ Employees | 40 | 50 | 50 | 45 | 185 |
Average Sales Cycle Length by Sales Channel & Complexity of Product
In the table below, we analyze how different sales channels and product complexity levels impact sales cycle duration, revealing the significant advantages of inbound versus outbound approaches.
The Average Sales Cycle Length by Sales Channel & Complexity of Product – 2025
| Sales Channel | Low Complexity (days) | Medium Complexity (days) | High Complexity (days) |
|---|---|---|---|
| SEO | 28 | 50 | 75 |
| Google Ads | 34 | 55 | 80 |
| Email Marketing | 42 | 60 | 85 |
| Cold Calling | 60 | 85 | 110 |
| Social Media Outreach | 48 | 72 | 95 |
| Direct Mail | 65 | 90 | 120 |
| Content Marketing | 38 | 68 | 95 |
| PPC (other than Google Ads) | 36 | 62 | 92 |
| Trade Shows | 80 | 100 | 150 |
| Webinars | 45 | 80 | 130 |
| Partnerships/Affiliates | 30 | 60 | 105 |
| Referrals | 20 | 35 | 60 |
Our findings were particularly interesting, as inbound channels drastically cut the sales cycle length, whereas outbound channels extended it, requiring a greater degree of rapport to be built before true selling could occur.
Sales Cycle Length by Deal Size (ACV)
The following data shows the correlation between deal size and sales cycle length, confirming that larger contracts typically require more time and resources to close.
The Sales Cycle Length by Deal Size (ACV) – 2025
| Deal Size (ACV) | Average Sales Cycle (days) |
|---|---|
| < $1,000 | 25 |
| $1,000 – $5,000 | 40 |
| $5,000 – $10,000 | 55 |
| $10,000 – $50,000 | 75 |
| $50,000 – $100,000 | 120 |
| $100,000 – $250,000 | 170 |
| $250,000 – $500,000 | 220 |
| > $500,000 | 270 |
What we found confirms a key sales principle: larger deals nearly always demand more time and resources to close. Small-ticket deals under $10,000 often close within weeks, while enterprise-level deals can take nearly a year to finalize.
Understanding this correlation allows teams to more accurately forecast sales and allocate appropriate resources based on potential value.
How to Shorten Your Sales Cycle Length
The length of the sales cycle depends on how long it takes for the prospect to become fully convinced that you are the solution to their want, need, or desire. This generally happens in two stages, as the prospect must trust you personally first, and then they must trust that your delivery mechanism will achieve their desired result.
| Trust Milestones | |
|---|---|
| Trust in You |
Buyers assess you before they assess your offer. Position yourself as an expert who understands their world. Relevance shows you’ve done your homework. Feeling understood reduces friction and speeds up the sale. |
| Trust in Your Process |
Buyers need proof that your system works, not generic promises. Each sales asset should remove a specific fear or doubt. Clear process steps reduce hesitation and delays. The more your process aligns with theirs, the faster they buy. |
For example, let’s pretend for a moment you own a manufacturing company making small components to assemble final products for other companies. A prospect must initially believe that you are trustworthy before they allow you to sell them on the promise that your company can make their needed components to spec, deliver on time, etc.
To do this, the most important factors are what we refer to as sales assets. A sales asset is comprised of any sources of proof that you can deliver what you say you can deliver. The following are examples of sales assets:
| Sales Assets | |
|---|---|
| Client testimonials | Thought leadership content |
| Case studies | Sample work |
| Customer interview | Process explanations |
*Each of the above is linked to an example
Why Sales Assets Need to Be Specific
Each sales asset functions as evidence that validates your ability to deliver promised results. The primary function of every sales asset is risk reduction for the buyer. Elite sellers distinguish themselves through specificity in their proof points:
- The more specific your proof is to the buyer’s exact situation, the more powerful it becomes
- Generic trust signals provide minimal reassurance to discerning buyers
- When sales assets directly address unique challenges, they build genuine confidence
- Your goal extends beyond demonstrating understanding—paint a clear picture of successful outcomes
Consider this practical example: A widget manufacturer might possess extensive client testimonials across various industries. However, when selling to agricultural businesses, testimonials specifically from other farmers who achieved measurable improvements carry significantly more persuasive weight.
The closer your proof mirrors the prospect’s exact situation, industry, and challenges, the faster you progress toward closing the sale. This principle applies across all sales assets: case studies from similar company sizes, testimonials from identical use cases, and process explanations that address specific implementation concerns all accelerate the trust-building process that drives sales cycle velocity.
Further Reading & Next Steps
Our team specializes in developing sales assets and strategic content to convert prospects into customers. We take the time to learn the aspects of your business that are the true selling points and convey that to prospects during the sales process in the right order, at the right time. To learn more about this, see the following further reading:
- Average Cold Call Conversion Rate by Industry
- Customer Acquisition Cost Trends
- Our Strategic Planning Guide
For any further questions, we invite you to contact us on our Contact Us page.
Sources:
- Focus Digital Research Study – Focus Digital, August 2025, Greensboro, North Carolina
- Evaluate your team’s performance with these 2024 B2B sales benchmarks – Gradient Works, 2024, San Francisco, California
- B2B Sales Cycle Length: How Long Does It Usually Take to Close a Deal? – Databox, 2024, Boston, Massachusetts
- Sales 2024: A revenue data analysis – Outreach, 2024, Seattle, Washington
- 2024 B2B Sales & Marketing Benchmark Report – Various Industry Sources, 2024, United States