Average pages per session is a metric with arguably the closest correlation with user satisfaction from the content curated on a website page. While average session duration is important, the metric does not sufficiently account for the true purpose of top-of-funnel content: moving visitors through the funnel, towards more conversion-oriented content.
This analysis compiles industry benchmarks and recommended targets, plus breakdowns by product price point and traffic channel, to help teams set goals and optimize UX for deeper browsing and better conversions.
- Average Pages per Session: Industry Benchmarks
- Average Pages Per Session by Product Price Point
- Average Pages Per Session by Traffic Channel
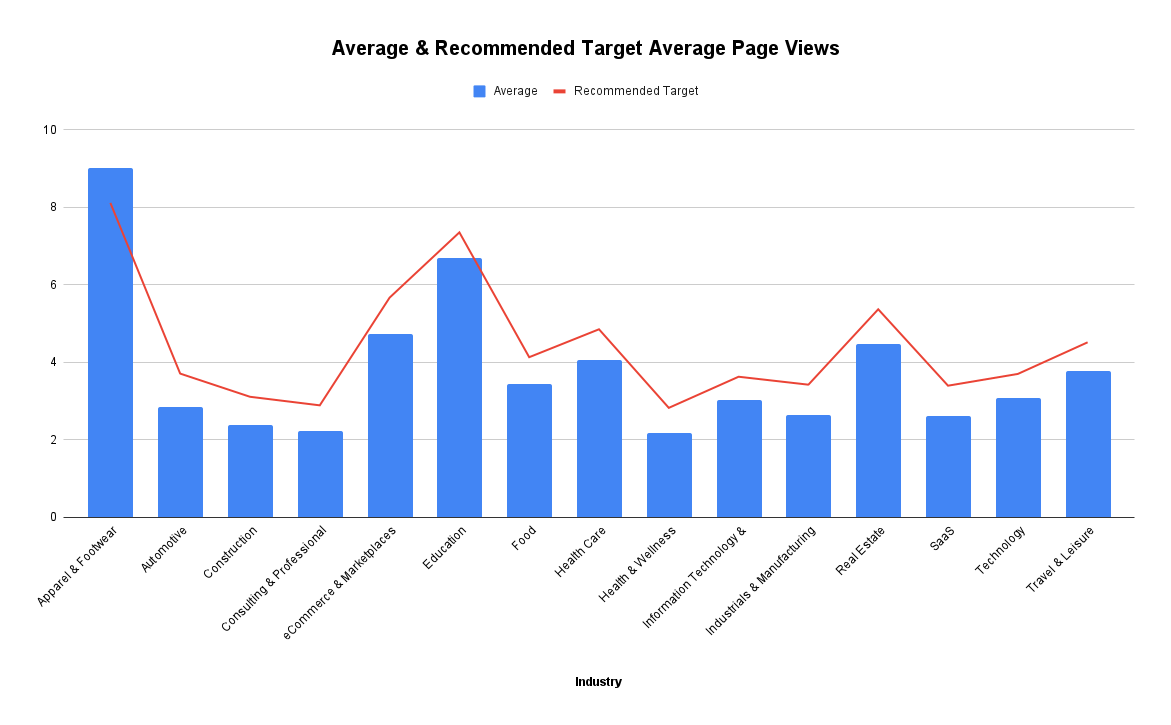
In the table below, we break down average pages per session benchmarks across major industries, along with our recommended targets for optimal conversion performance.
Average Pages Per Session: Industry Benchmarks
| Industry | Average | Recommended Target |
|---|---|---|
| Apparel & Footwear | 9.01 | 8.11 |
| Automotive | 2.85 | 3.71 |
| Construction | 2.39 | 3.11 |
| Consulting & Professional Services | 2.22 | 2.89 |
| eCommerce & Marketplaces | 4.72 | 5.66 |
| Education | 6.68 | 7.35 |
| Food | 3.44 | 4.13 |
| Health Care | 4.04 | 4.85 |
| Health & Wellness | 2.17 | 2.82 |
| Information Technology & Services | 3.02 | 3.62 |
| Industrials & Manufacturing | 2.63 | 3.42 |
| Real Estate | 4.47 | 5.36 |
| SaaS | 2.61 | 3.39 |
| Technology | 3.08 | 3.70 |
| Travel & Leisure | 3.76 | 4.51 |
Key Insights:
- Industries with higher product variety (e.g., Apparel & Footwear) see elevated page views as users compare options before converting.
- B2B services (Consulting, SaaS, Technology) cluster around 2.2–3.1 pages, reflecting targeted browsing behavior.
- Education and Healthcare show higher engagement due to research-intensive decision-making.
Average Pages Per Session by Product Price Point
In the table below, we examine how product pricing influences user browsing behavior and provide optimized targets for each price range.
The Average Pages Per Session by Price Point – 2025
| Price Point Range | Average | Recommended Target |
|---|---|---|
| $5 – $30 | 7.5 | 8 |
| $20 – $150 | 6.8 | 7.5 |
| $50 – $300 | 5.6 | 6 |
| $100 – $1,000 | 4.8 | 5.3 |
| $1,000 – $10,000 | 3.5 | 4 |
| $5,000 – $50,000 | 3 | 3.5 |
| $10,000 – $50,000 | 2.8 | 3.3 |
| $15,000 – $40,000 | 2.7 | 3 |
| $40,000 – $100,000 | 2.5 | 2.8 |
| $50,000 – $500,000 | 2.4 | 2.7 |
| $100,000 – $1M+ | 2.3 | 2.5 |
| $500,000 – $5M+ | 2.2 | 2.4 |
Key Insights:
- Lower-priced products drive more comparison shopping and higher page depth.
- Enterprise-level purchases ($100K+) show focused browsing on only the most relevant content.
- Targets slightly above the average for each band are a practical “sweet spot.”
Average Pages Per Session by Traffic Channel
In the table below, we analyze how different traffic sources impact user engagement and browsing depth.
Average Pages Per Session by Traffic Channel – 2025
| Traffic Source | Average Pages per Session |
|---|---|
| SEO (Organic Search) | 5.8 |
| Direct Traffic | 4.3 |
| Referral | 4.0 |
| Email Marketing | 3.6 |
| Social Media | 3.2 |
| Paid Search | 2.9 |
Key Insights:
- Organic search shows the highest engagement—strong intent and content match.
- Paid traffic has the lowest browsing depth; use tighter message-match and focused landing pages.
- Email performs moderately well, aided by prior brand trust.
Improving Your Average Pages Per Session
The best way to improve your average pages per session is to write content that is more satisfying to the visitor by taking the time to understand the strategic purpose of each page.
Pages such as blogs are meant to present visitors with content positioning your brand as a thought leader, not to sell the product. Product or service pages are meant to display benefits and sell your product as an option, not convey the story of your brand. The about page should connect visitors with the personal side of your business, not advertise the products.
By understanding the purpose of each page, we can improve the average pages per session, as visitors naturally progress from the top of the funnel to the middle of the funnel to the bottom of the funnel as they are sold on your thought leadership, your products, and finally, your company. These must be taken in this order, as it is a mirror of human psychology.
Content Structure: Traffic Should Naturally Flow from Left to Right
When pages per session are tracked properly, we are looking to see traffic generated in the top-of-funnel segment of the content structure, with the middle of the funnel serving as a transitional stage between traffic generation and traffic conversion.

Next Steps & Further Reading
If you are interested in reading further on this topic, we recommend the following articles:
- Customer Acquisition Cost Benchmarks by Industry
- Customer Acquisition Cost Trends
- Full Video SEO Training
If you are interested in learning more about implementing a content strategy that satisfies user intent and moves them further down the funnel toward becoming a lead, we are happy to consult. Feel free to contact us here.