The average B2B cold email open rate is ~36% across all industries, but this number lacks the specificity needed to measure the results of cold email campaigns as the open rates vary widely by industry. Some industries rely more heavily on email as a communication medium, naturally raising open rates, versus other industries where email is less commonly used for organizational communication, which can lower open rates.
We performed a meta-analysis of cold email campaigns across 35 B2B industries commonly relying on cold email as a lead generation mechanism to determine the average cold email open rate. This report assumes the proper infrastructure is in place for deliverability, including DMARC, a proper 2-4 week warming period, SPF, and DKIM. This report also assumes you have filtered the email for spam words and phrases that may hurt deliverability.
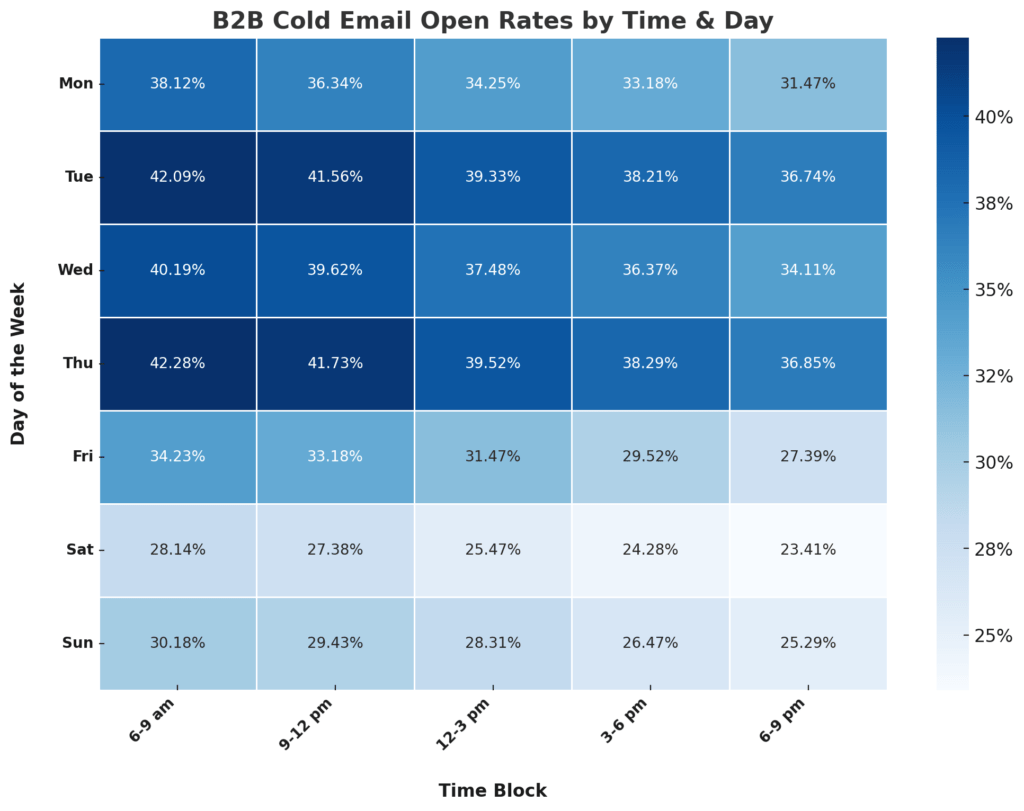
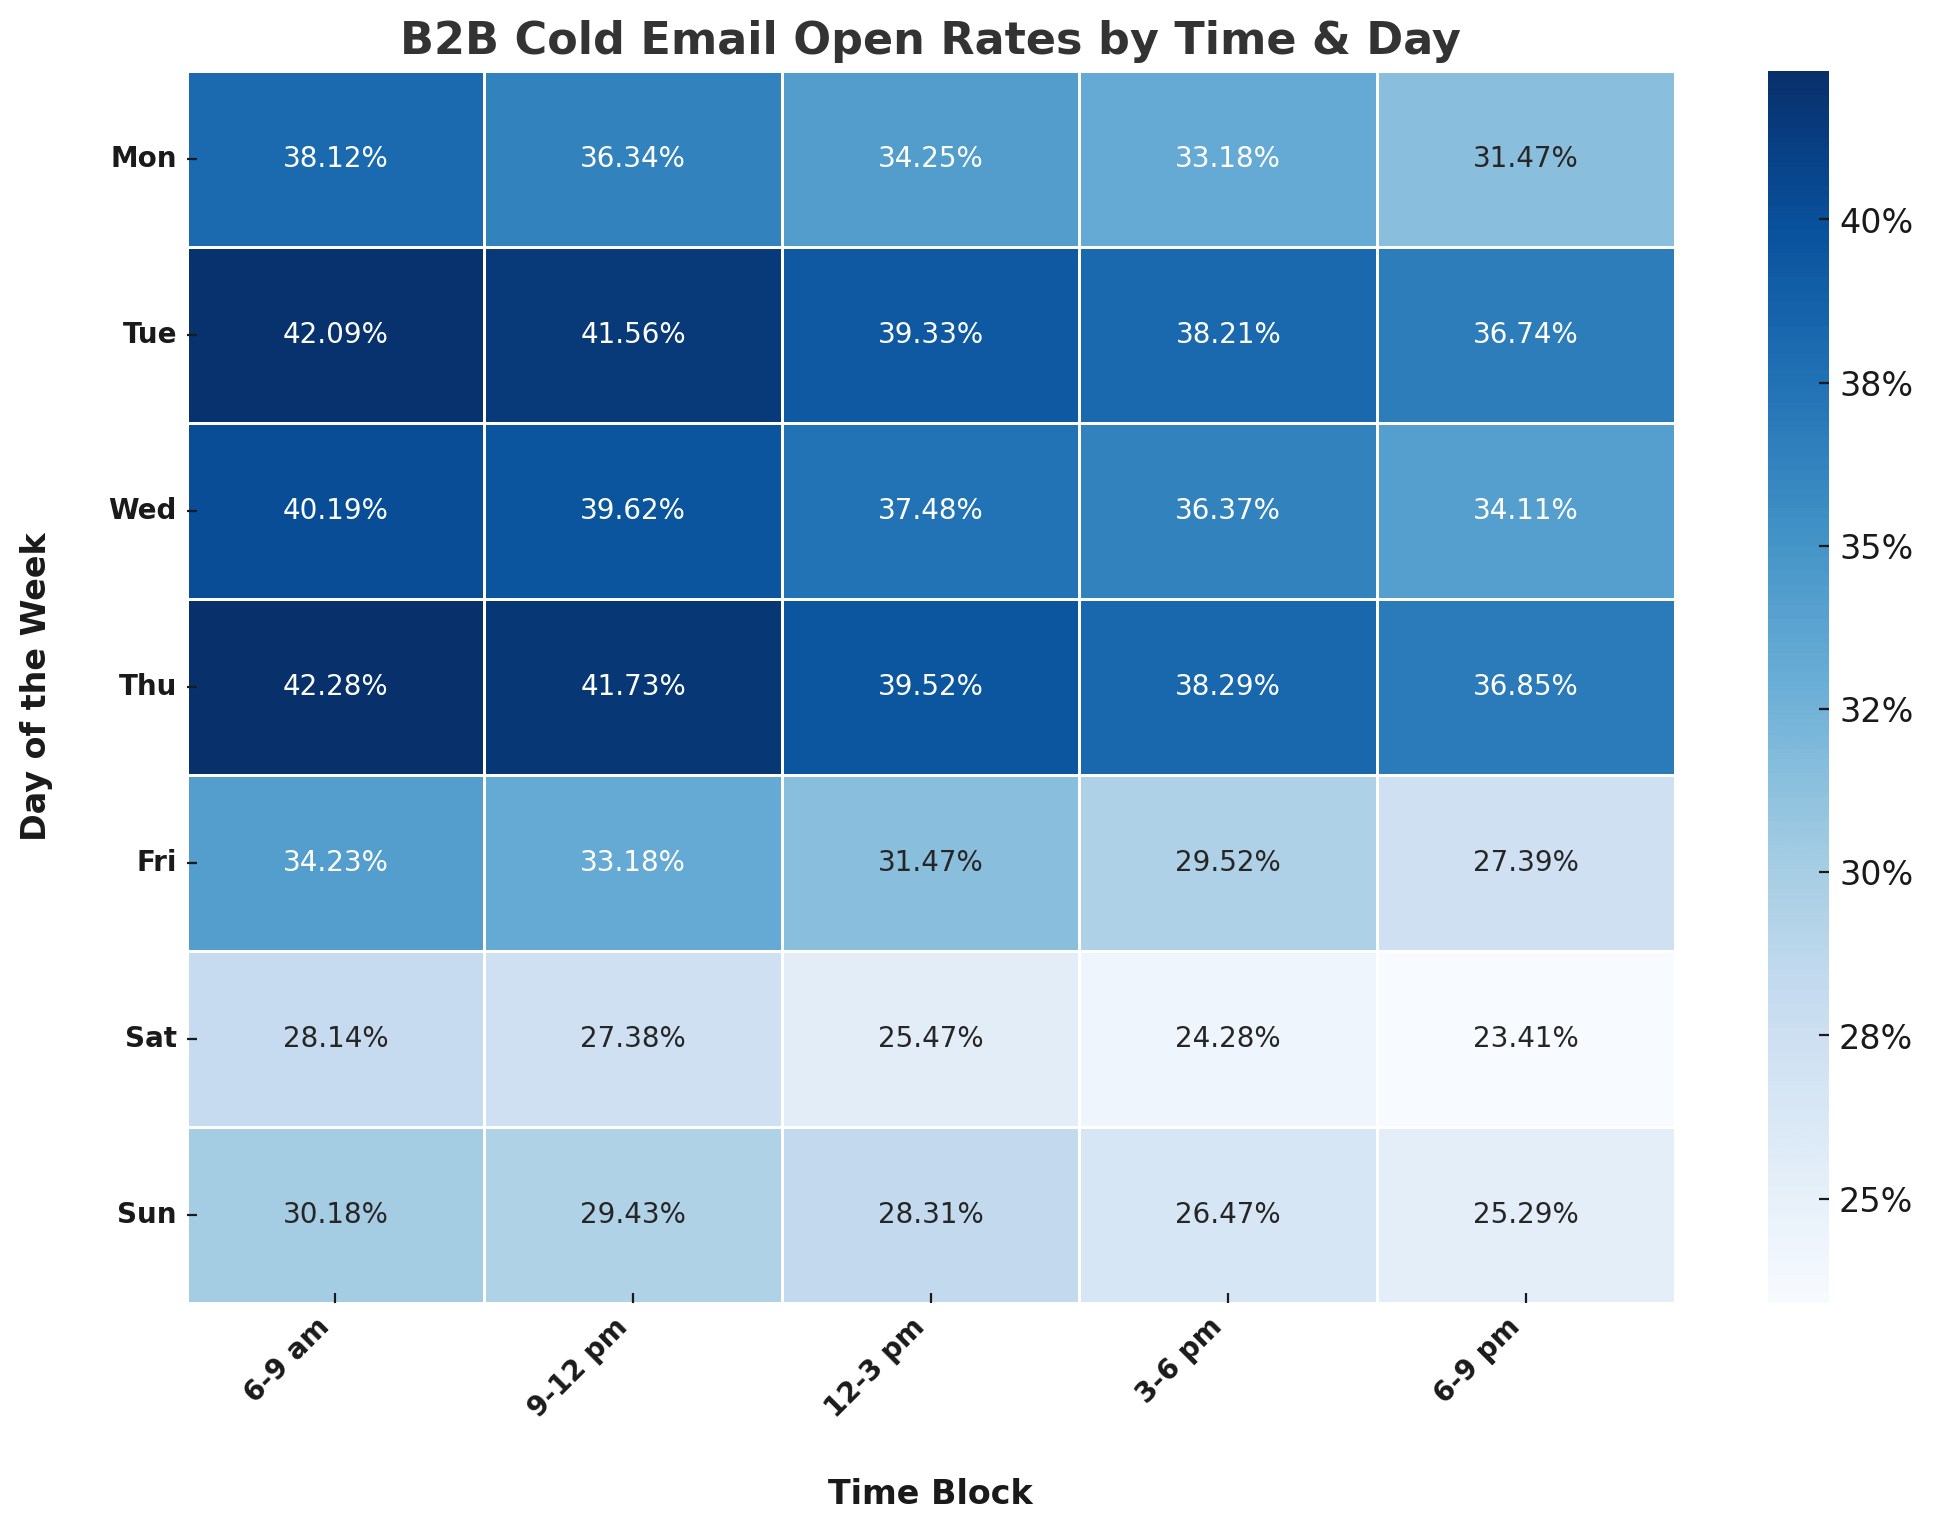
We also segmented our data by subject line and the date/time the email is sent, as these details heavily influence open rates. The best time to send a cold email was Thursday between 6 and 9 am, with “Hi {{first_name}}” being the top performing subject line in our study.
This report should not be considered authoritative for any B2C email communications, as cold B2C emails are considered spam by the CAN-SPAM Act of 2003, so any users being emailed must have opted into the list, which will naturally change the dynamic of the behavior of the recipients. Lastly, this report is not a benchmark of where a campaign should be performing for maximum output, but rather an average of where most campaigns are performing.
Average B2B Cold Email Open Rates by Industry
The following table lists the most common industries reliant on cold email and the associated average open rates for that industry.
| Industry | Open Rate |
|---|---|
| SaaS (Software as a Service) | 23.75% |
| IT Services | 25.24% |
| Cybersecurity | 25.21% |
| Cloud Computing | 24.72% |
| Consulting Services | 26.71% |
| Marketing and Advertising | 25.11% |
| Financial Services | 25.73% |
| Legal Services | 29.02% |
| Human Resources and Recruiting | 28.23% |
| Machinery and Equipment | 24.18% |
| Electronics | 27.49% |
| Automotive | 27.23% |
| Chemical Manufacturing | 24.89% |
| Medical Devices | 27.07% |
| Pharmaceuticals | 24.94% |
| Healthcare Services | 25.80% |
| Biotechnology | 32.15% |
| Corporate Training Programs | 33.47% |
| Educational Software | 25.93% |
| E-learning Platforms | 29.29% |
| Freight and Shipping | 36.62% |
| Supply Chain Management | 33.51% |
| Transportation Services | 28.00% |
| Commercial Real Estate | 35.56% |
| Property Management | 31.61% |
| Real Estate Technology | 32.91% |
| Investment Firms | 42.01% |
| Insurance Companies | 24.09% |
| Accounting Services | 36.55% |
| Wholesale Suppliers | 37.53% |
| E-commerce Platforms | 26.03% |
| Retail Technology Solutions | 26.95% |
| Renewable Energy Solutions | 31.24% |
| Oil and Gas Services | 41.52% |
| Energy Management Systems | 42.79% |
Average B2B Cold Email Open Rates by Subject Line
Below, we’ve included our findings on the average open rate by subject line for common subject lines. These subject lines should all be tested when launching a campaign, as these open rates are cyclical. As more people use one subject line, open rates go down, and vice versa.
| Subject Line | Open Rate |
|---|---|
| Hi {{first_name}} | 41.88% |
| How {{company_name}} can {{desired-result}} | 40.17% |
| Quick question | 33.65% |
| Thoughts, {{first_name}}? | 39.47% |
| {{first_name}}, 5 - 8 more customers this month? | 38.68% |
| {{first_name}} <> Your Name | 39.69% |
| Intro | 37.97% |
| {{first_name}}, made this for you | 39.44% |
| {{first_name}}, am I off here? | 39.68% |
| {{first_name}}, (problem / pain point) initiatives for {{company_name}}? | 40.13% |
| {{first_name}}, improving (problem / pain point) at {{company_name}}? | 40.12% |
| {{first_name}}, can I get your feedback here? | 40.11% |
| {{first_name}}, {{name}} referred me | 39.70% |
Average B2B Cold Email Open Rates by Day/Time of Email
The following table gives the average open rates by the time the email was sent.
Day Time Open Rate
Monday 6-9 am 38.12%
9-12 pm 36.34%
12-3 pm 34.25%
3-6 pm 33.18%
6-9 pm 31.47%
Tuesday 6-9 am 42.09%
9-12 pm 41.56%
12-3 pm 39.33%
3-6 pm 38.21%
6-9 pm 36.74%
Wednesday 6-9 am 40.19%
9-12 pm 39.62%
12-3 pm 37.48%
3-6 pm 36.37%
6-9 pm 34.11%
Thursday 6-9 am 42.28%
9-12 pm 41.73%
12-3 pm 39.52%
3-6 pm 38.29%
6-9 pm 36.85%
Friday 6-9 am 34.23%
9-12 pm 33.18%
12-3 pm 31.47%
3-6 pm 29.52%
6-9 pm 27.39%
Saturday 6-9 am 28.14%
9-12 pm 27.38%
12-3 pm 25.47%
3-6 pm 24.28%
6-9 pm 23.41%
Sunday 6-9 am 30.18%
9-12 pm 29.43%
12-3 pm 28.31%
3-6 pm 26.47%
6-9 pm 25.29%

Further Reading & Next Steps
For further reading on customer acquisition cost statistics, lead magnet conversion rates, and marketing funnel KPIs, see our other reports below:
- Customer Acquisition Cost by Industry Statistics
- Lead Magnet Conversion Rates by Industry
- Marketing Funnel KPIs By Funnel Type
For a copy of this report, contact us here.
Sources:
- Cold B2B Email Stats – Effective Series – B2B Rocket
- How to Improve Cold Email Open Rates – Klenty
- Sales Development Technology: The Stack Emerges – Gartner
- Cold Email Statistics – QuickMail
- Best Time to Send Cold Email – Siege Media
- Best Time to Send Cold Emails – Hyperise
- Best Times to Send Cold Emails – Mixmax
