The average direct mail response rate is 3.63%, but this can vary based on the industry in which the mail is sent, how responses are measured, and the time of year in which the direct mail is sent. Our team performed a comprehensive study on direct mail response rates, compiling information from first and third-party sources to ensure our data is precise and accurate.
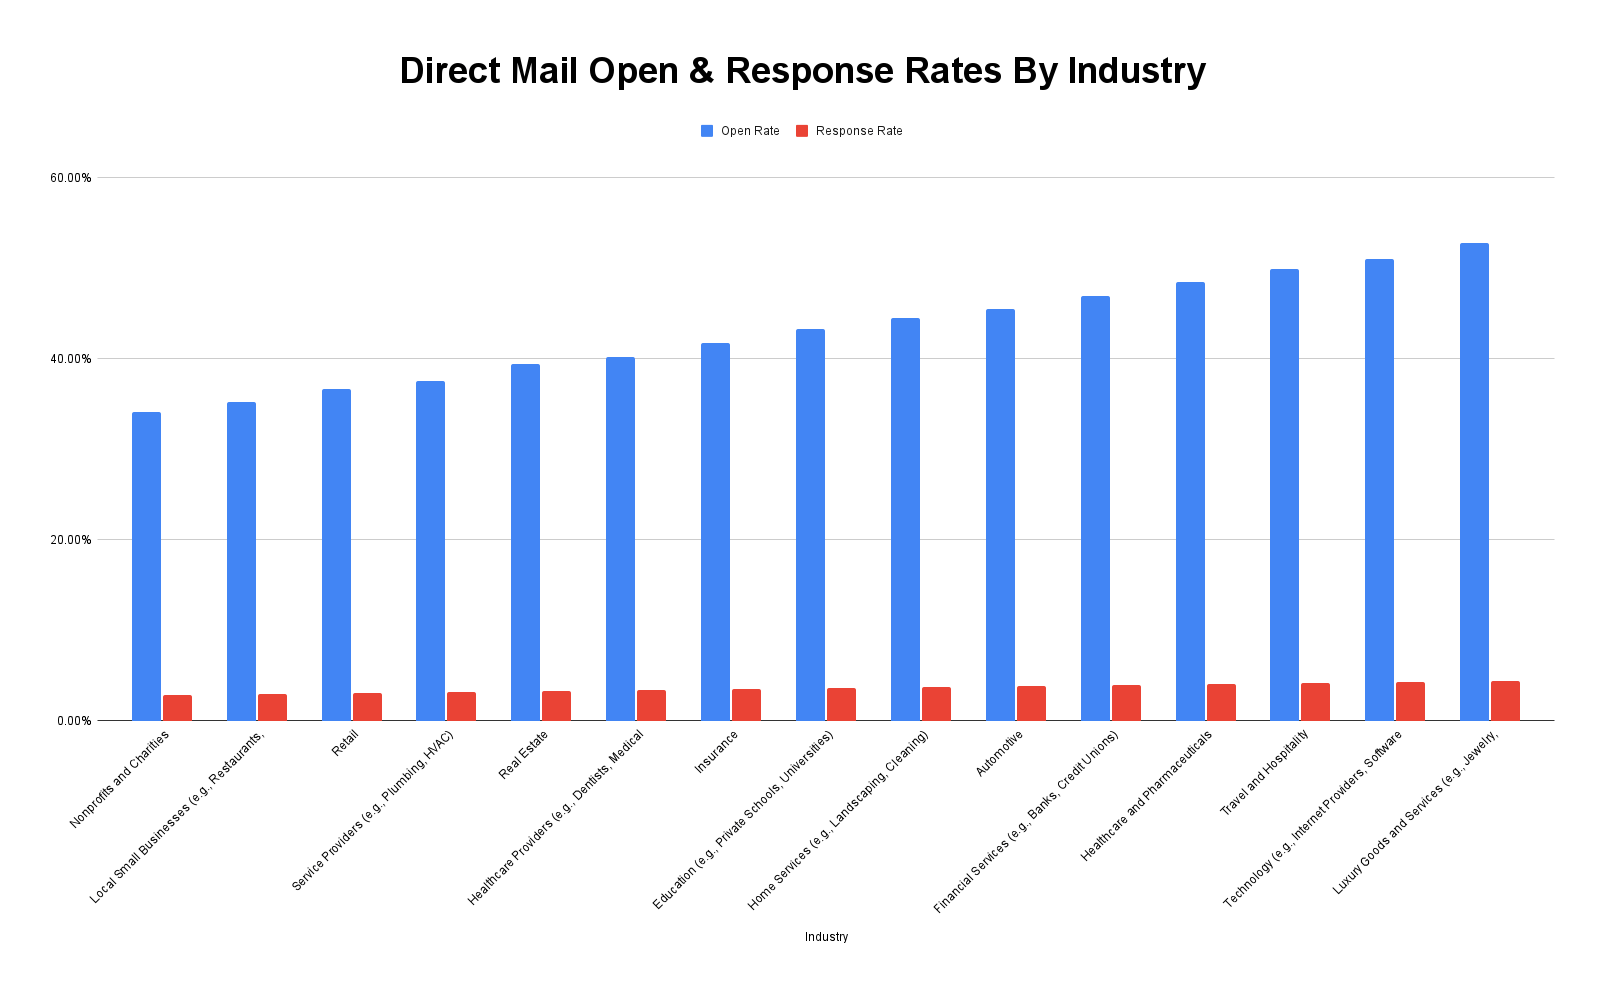
In our study, we considered how direct mail response rates will vary heavily by industry due to the inundation of direct mail in certain industries such as financial services, nonprofits, and retail. On the other end of the spectrum, industries not typically involved in direct mail such as software, entertainment, and hospitality may result in higher response rates, as prospects are less likely to view the mail as spam due to the the low volume of mail received from that type of company.
For the purpose of this report, ~70% of the campaigns we studied were from targeted lists of prospects, not untargeted direct mail blasts. Untargeted direct mail blasts generally result in low response rates, varying widely between the lowest and highest response rates.
Direct Mail Response Rates by Industry
In this table, we compiled the result of our study of direct mail response rates by industry.
| Industry | Open Rate | Response Rate |
|---|---|---|
| Nonprofits and Charities | 34.12% | 2.86% |
| Local Small Businesses (e.g., Restaurants, Salons) | 35.27% | 2.96% |
| Retail | 36.73% | 3.09% |
| Service Providers (e.g., Plumbing, HVAC) | 37.57% | 3.16% |
| Real Estate | 39.48% | 3.32% |
| Healthcare Providers (e.g., Dentists, Medical Clinics) | 40.24% | 3.38% |
| Insurance | 41.71% | 3.51% |
| Education (e.g., Private Schools, Universities) | 43.30% | 3.64% |
| Home Services (e.g., Landscaping, Cleaning) | 44.58% | 3.75% |
| Automotive | 45.56% | 3.84% |
| Financial Services (e.g., Banks, Credit Unions) | 46.92% | 3.95% |
| Healthcare and Pharmaceuticals | 48.55% | 4.09% |
| Travel and Hospitality | 49.92% | 4.21% |
| Technology (e.g., Internet Providers, Software Solutions) | 51.06% | 4.30% |
| Luxury Goods and Services (e.g., Jewelry, High-End Retail) | 52.85% | 4.46% |
While this data is important, it only tells part of the story. The barrier to entry for a response is also critical to the response rate. If a response is measured by someone submitting an order for a product and returning payment information, responses will be much lower than if someone simply opts in to receive a phone call or further information with a pre-written and stamped postcard.
Direct Mail Response Rates by Response Type
This table gives the average direct mail response rate by response type.
| Mailer Type | Response Rate |
|---|---|
| Postcard | 2.79% |
| Flyer or Brochure | 4.61% |
| Self-Mailer | 6.27% |
| Letter in Envelope | 8.38% |
| Catalog | 10.30% |
| Dimensional Mailer (e.g., Boxes) | 12.19% |
| Gift Card or Coupon Packet | 13.81% |
| Video Mailer or Video Tablet | 15.31% |
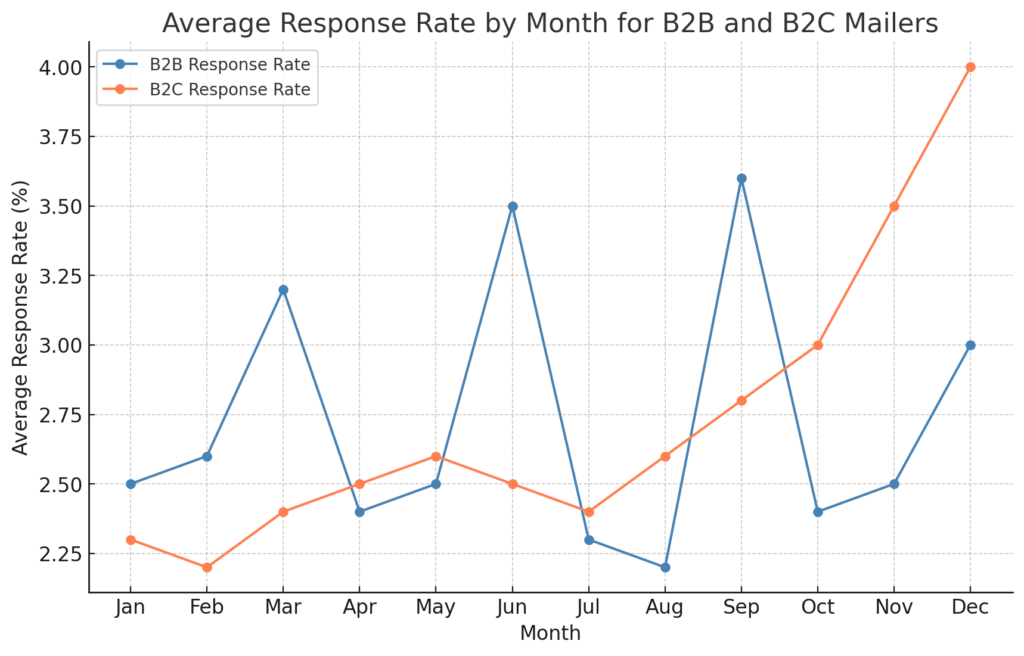
During the course of our study, we also noticed substantial changes in response rates based on the time of year of the direct mail campaign. This can also vary by industry, but generally, B2B response rates and B2C response rates are inverted, with B2C responses peaking around the holidays, and B2B response rates peaking at the end of each quarter for unspent budgets.
Direct Mail Response Rates by Time of Year
The following information gives the average response rate by the time of year.

Lastly, our team noticed a significant variation in the response rates based on the type of mailer sent. Some mailers will result in a stronger response due to either personalization, quality, or size. We have broken down our data for this below.
Direct Mail Response Rates by Type of Mailer
This table gives the most common direct mail types and their response rates.
| Response | Response Rate |
|---|---|
| Opt-in to receive more information | 4.60% |
| Request a phone call or consultation | 4.15% |
| Complete and mail back a pre-addressed, pre-stamped postcard | 3.61% |
| Visit a website for more details or to claim a freebie | 3.00% |
| Redeem an in-store coupon | 2.49% |
| Schedule a free trial or appointment | 2.04% |
| Sign up for a loyalty or rewards program | 1.69% |
| Submit an order with payment details | 1.13% |
Further Reading & Next Steps
If you are considering a direct mail campaign, you are also most likely considering a cold email or cold calling campaign. We have compiled similar reports for both of these, which are linked below. We have also linked our report on customer acquisition cost trends, so you can stay up to date on the latest in CACs.
- Cold Email Conversion Rate by Industry
- Cold Call Conversion Rate by Industry
- Customer Acquisition Cost Trends
If you would like assistance in strategizing your marketing campaign, we specialize in building inbound lead generation systems, which generate more qualified leads on a consistent base. Please reach out here with any questions.
Sources:
