
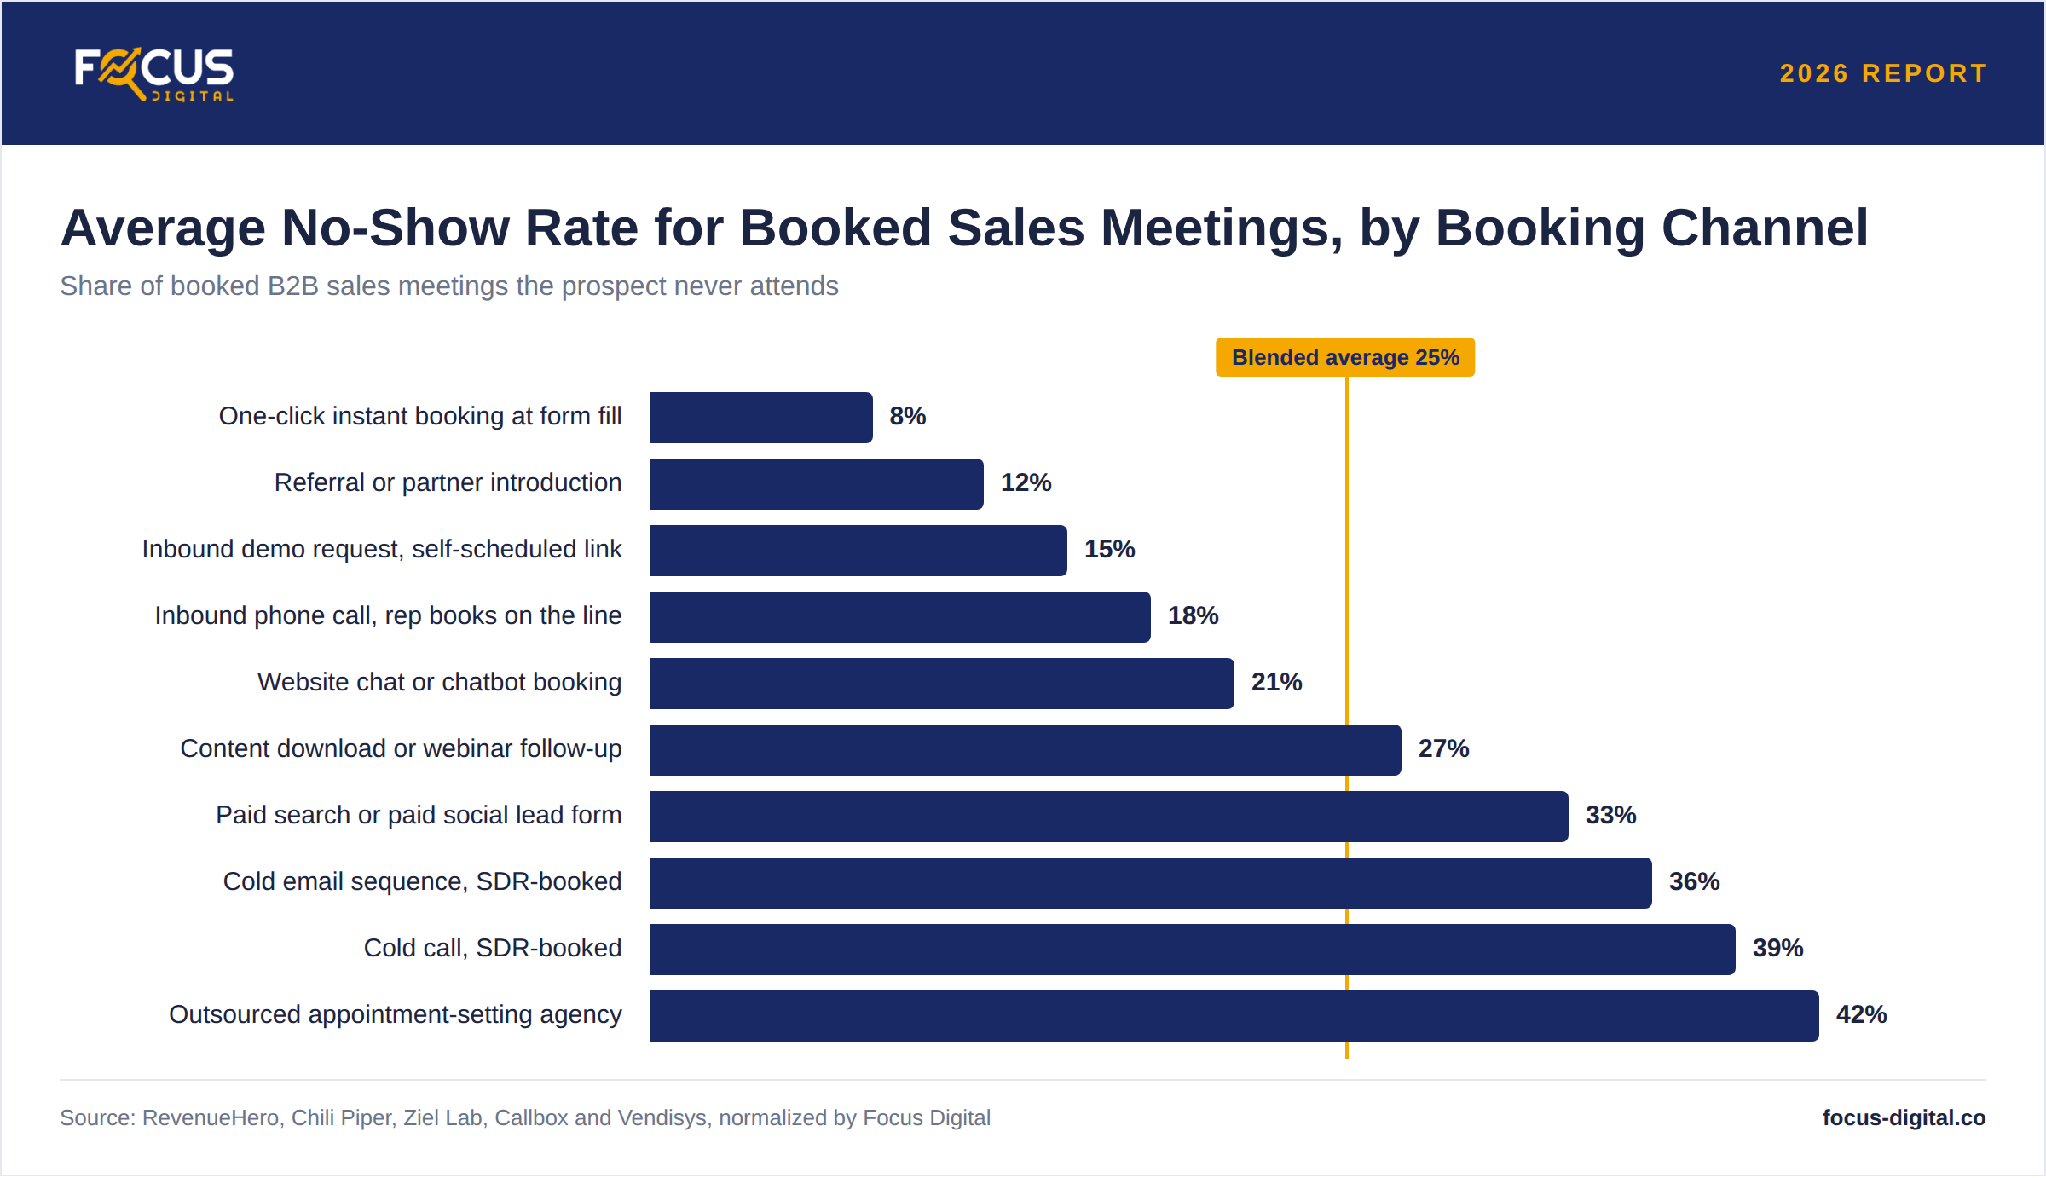
Roughly one in four booked B2B sales meetings never happens, and the booking channel swings that rate from 8% on one-click instant scheduling to 42% on outsourced appointment setting.
Our team verified every published dataset on booked-meeting attendance, then normalized each figure to one definition: a no-show counts when the prospect neither attends nor cancels ahead of time. Where a source published a span instead of a point estimate, we distributed channels inside it using our data-approximation methodology. The tables below open broad and narrow toward the channel that produced the booking.
KEY INSIGHTS:
KEY INSIGHTS:
 KEY INSIGHTS:
KEY INSIGHTS:
KEY INSIGHTS:
Key Takeaways
- The blended 2026 no-show rate for booked B2B sales meetings sits near 25%, which costs a team one meeting for every four it books.
- One-click instant scheduling at form fill averages a 92% show rate, putting no-shows at roughly 8% and beating every rep-scheduled channel we measured.
- SDR-booked cold outbound loses 35% to 45% of its meetings, four to five times what the strongest inbound motion loses.
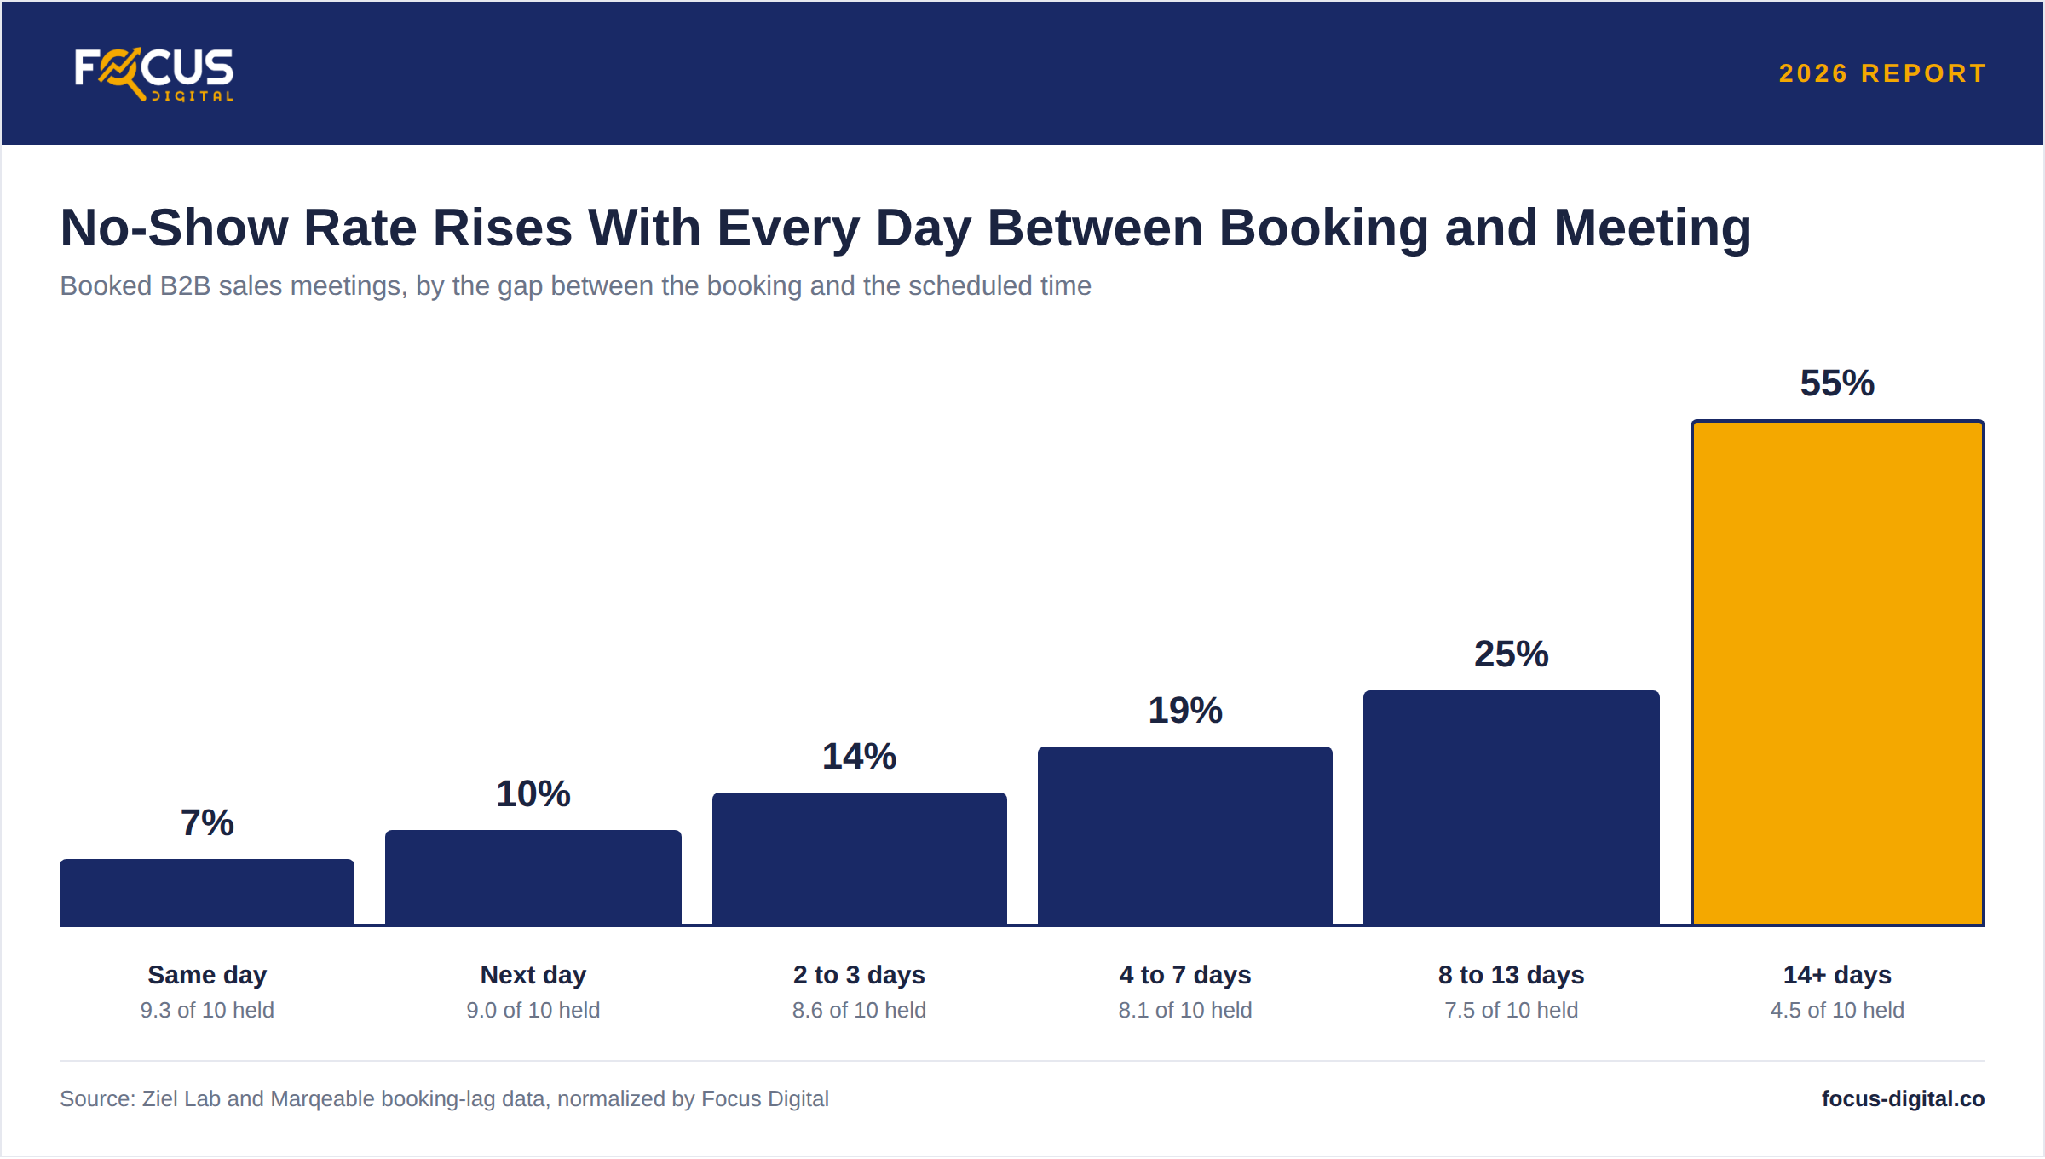
- A meeting set for the same day has a 7% no-show rate, while a meeting set two weeks out fails more often than it holds.
No-Show Rate Benchmarks by Performance Tier
No-show rate separates revenue teams more sharply than meetings booked ever will, because a booking becomes pipeline only when someone attends it. The table below establishes the 2026 baseline across six performance tiers.| Performance Tier | No-Show Rate | Meetings Held per 10 Booked |
|---|---|---|
| Best in class | 3.1% | 9.7 |
| Top decile | 5.5% | 9.5 |
| Median, teams using instant scheduling | 13.5% | 8.7 |
| Mean, teams using instant scheduling | 15.9% | 8.4 |
| Blended B2B average across all channels | 25.0% | 7.5 |
| Bottom tier, unqualified outbound lists | 42.0% | 5.8 |
- The gap between the median and best-in-class tier costs a team booking 100 meetings a month roughly 10 lost conversations every month.
- Scheduler-level datasets report far lower no-shows than blended market surveys, because those customers already removed the booking friction that creates most misses, so benchmark against the tier matching your own setup.
Average No-Show Rate by Booking Channel
Booking channel predicts attendance better than any firmographic split because it captures who initiated the meeting. A prospect who picks a slot seconds after requesting a demo has committed to the evaluation, while a prospect an SDR persuaded onto a calendar has committed only to the SDR. Our analysis below places each channel inside the spans published for inbound and outbound motions.| Booking Channel | No-Show Rate | Meetings Held per 10 Booked |
|---|---|---|
| One-click instant booking at form fill | 8.0% | 9.2 |
| Referral or partner introduction | 12.0% | 8.8 |
| Inbound demo request, self-scheduled link | 15.0% | 8.5 |
| Inbound phone call, rep books on the line | 18.0% | 8.2 |
| Website chat or chatbot booking | 21.0% | 7.9 |
| Content download or webinar follow-up | 27.0% | 7.3 |
| Paid search or paid social lead form | 33.0% | 6.7 |
| Cold email sequence, SDR-booked | 36.0% | 6.4 |
| Cold call, SDR-booked | 39.0% | 6.1 |
| Outsourced appointment-setting agency | 42.0% | 5.8 |
- Moving inbound leads from a self-scheduled link to one-click booking at form fill recovers roughly 7 meetings for every 100 booked, and it doubles form-to-meeting conversion from 30% to 66.7%.
- Outbound channels need a 1.6x booking volume premium to match inbound on held meetings, and the webinar row tracks the 47.7% live attendance rate for registrants delivered across 33,786 sessions.
Average No-Show Rate by Booking Lag
Lag explains most of the channel spread, because intent decays every day a prospect waits. Our data indicates the following pattern across the gap between booking and meeting.
KEY INSIGHTS:
- A slot booked for the same day outperforms one booked eight days out by 70%, which makes booking speed the cheapest lever available to a revenue team.
- Published series diverge past the one-week mark, with estimates for meetings booked two weeks out running anywhere from 42% to 67%, so every team should measure its own long-lag cohort before modeling it.
Average No-Show Rate by Industry
Industry shifts attendance through how personally the buyer owns the evaluation, and technical buyers who requested the meeting themselves show up almost without exception. The figures below come from a scheduler-level analysis of 6,428 booked B2B meetings.| Industry | No-Show Rate | Meetings Sampled |
|---|---|---|
| Healthcare software | 0.0% | 179 |
| Developer tools | 1.2% | 241 |
| IT and security | 1.8% | 395 |
| Data and analytics | 2.8% | 318 |
| Marketing software | 4.6% | 522 |
| Real estate software | 15.1% | 714 |
| Education and e-learning | 18.1% | 425 |
| All industries | 6.5% | 6,428 |
- Education software loses 15 times as many meetings as developer-tool vendors, even though both booked through the same scheduling layer.
- Real estate and education generated 185 of the 419 total no-shows while supplying under a fifth of the sample, which pulls the all-industry average well above what most software categories experience.
Levers That Reduce Sales Meeting No-Shows
Reminder cadence drives most of the improvement a team can capture without changing its channel mix, and booking speed drives the rest. The table below models each intervention against a 25% starting point.| Intervention | Reported Reduction | Resulting No-Show Rate |
|---|---|---|
| Single SMS reminder | 38% | 15.5% |
| Automated voice reminder | 29% | 17.8% |
| Two automated reminders plus meeting personalization | 30% to 40% | 15.0% to 17.5% |
| Multi-channel reminders across SMS and email | 30% to 60% | 10.0% to 17.5% |
| Same-day slot instead of a slot 8 or more days out | 70% | 7.5% |
- Prospects open text reminders at 98% against roughly 20% for email, so a single message recovers nearly 10 percentage points of attendance.
- Teams that work no-shows within 48 hours reschedule 30% to 50% of them, so recovery deserves its own workflow instead of a place on a task list.
Further Reading
- Average Sales Call Conversion Rate by Industry: 2026 Report
- Average Cost Per Qualified Lead: 2026 Report
- Average Cold Call Conversion Rate by Industry: 2026
- Average Sales Cycle Length by Industry: 2026
- Average Webinar Length to Conversion Ratio: 2026 Report
Request a PDF Copy of This Report
Revenue leaders who want to rebuild a cost-per-meeting model on held meetings instead of booked ones can request the full PDF. Reach out through our contact page, and we will send a copy over.Sources
- No-Shows Benchmark in B2B Industry
- How to Reduce No-Show Rates in B2B Sales Calls
- 2025 Benchmark Report on Demo Form Conversion Rates
- Scheduling Software for Revenue Teams
- Sales Meeting No-Shows: Fix the 30% That Vanish
- Demo No-Show Rate Benchmarks for B2B SaaS
- How to Improve B2B Appointment Show Rates
- What Is a Good Show Rate for Sales Appointments?
- How to Cut Demo No-Show Rates in Outsourced Outbound
- No-Show Statistics & Data 2026
- 6 Super-Simple Webinar Metrics to Measure Your Success